
What Is Business Intelligence? Definition, How It Works and Examples
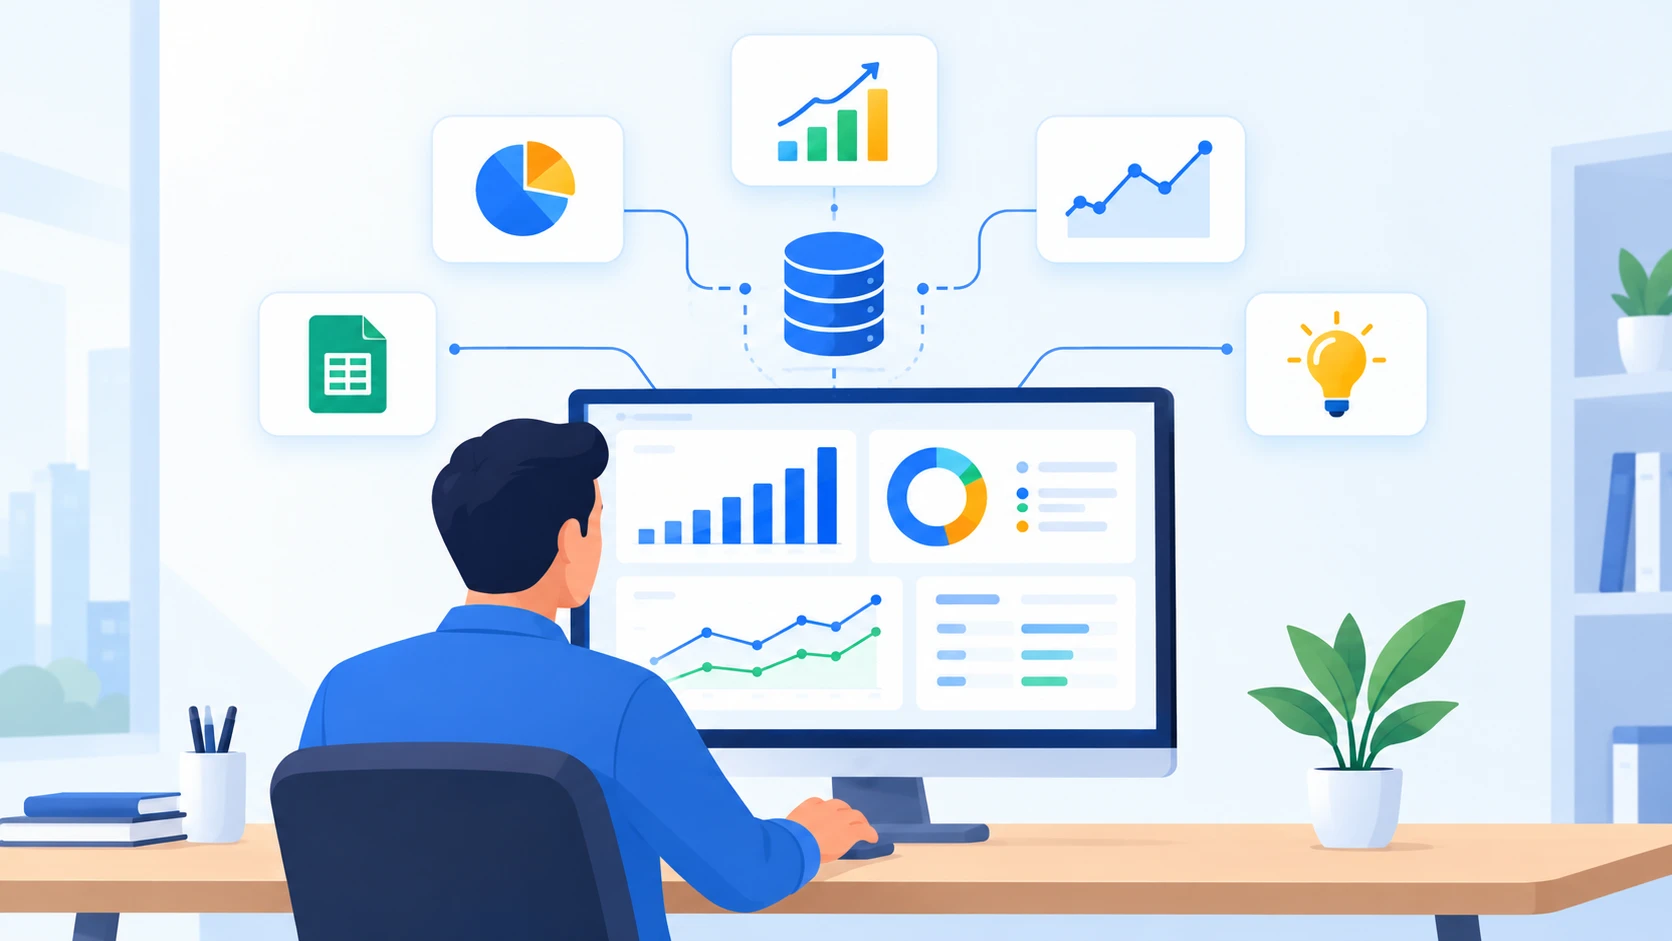
Quick Answer: What Is Business Intelligence?
Business intelligence (BI) is the set of technologies and processes an organization uses to collect, manage and analyze its data so it can make better decisions. IBM defines it as "a set of technological processes for collecting, managing and analyzing organizational data to yield insights that inform business strategies and operations" (IBM).
In practice, business intelligence works like this:
- Data sources: data sits in systems such as CRM, sales, marketing, finance and cloud applications.
- Collection and cleaning: the data is gathered and cleaned, often through an automated extract, transform and load (ETL) process.
- Storage: it lands in a central place such as a data warehouse or data lake.
- Analysis: analysts look for trends and patterns.
- Visualization and action: results appear in dashboards and reports, and people use them to change what the business does.
BI mainly answers the question "what happened?" It is descriptive, which is the main difference from business analytics, which looks forward. This guide explains the definition, history, components, tools and mistakes to avoid, using IBM, AWS, Microsoft and Wikipedia as sources.
Introduction
Business data is usually spread across systems. Sales numbers live in one system, customer records in another, marketing results in a third. Business intelligence exists to bring those pieces together so a manager can look at one view and see how the business is doing.
The term is easy to over-complicate. Underneath the vendor language, BI is a loop: gather data, organize it, look at it, decide, then check whether the decision worked. This article walks through that loop, the parts that make it work, how it relates to neighboring ideas like analytics and AI, and how a team can start.
If you already know the basics and want to compare BI with the forward-looking side of analytics, our guide to business intelligence vs business analytics covers the difference in depth.
What Is Business Intelligence?
Several well-known sources define business intelligence in very similar terms:
- IBM: "a set of technological processes for collecting, managing and analyzing organizational data to yield insights that inform business strategies and operations" (IBM).
- Wikipedia: the "strategies, methodologies, and technologies used by enterprises for data analysis and management of business information to inform business strategies and business operations" (Wikipedia).
Two things are worth noticing in these definitions. First, BI is not one product. It is a combination of technology, data management and method. Second, the stated goal is always the same: inform decisions. A dashboard nobody uses to decide anything is not business intelligence, however polished it looks.
What BI is not
- It is not the same as a dashboard tool. A tool is one piece of a BI system.
- It is not only for large companies. The ideas apply at any size, though the tools and effort scale differently.
- It is not automatic. Someone has to decide which questions matter, which data to trust and what to do with the answers.
A Short History of Business Intelligence
The phrase is older than the software industry around it.
- 1958: Hans Peter Luhn, an IBM researcher, used Webster's Dictionary definition of intelligence, "the ability to apprehend the interrelationships of presented facts in such a way as to guide action towards a desired goal."
- 1989: Howard Dresner, later an analyst at Gartner, proposed "business intelligence" as an umbrella term for "concepts and methods to improve business decision making by using fact-based support systems." Its use became widespread in the late 1990s (Wikipedia).
The thread running through both is the idea of guiding action with facts. The technology has changed from printed reports and mainframes to cloud platforms and interactive dashboards, but the purpose has not.
How Does Business Intelligence Work?
IBM describes the BI process in five stages. They map neatly onto how most BI projects are built (IBM).
1. Identify the data sources
Organizations pull data from many places: data warehouses and data lakes, cloud systems, CRM, sales and marketing platforms, and social media. The first job is knowing what exists and who owns it.
2. Collect and clean the data
Data is gathered and cleaned, using manual or automated ETL processes. AWS defines ETL as "the process of combining data from multiple sources into a large, central repository called a data warehouse." It has three steps: extract raw data from the sources, transform and consolidate it in a staging area by applying business rules, and load it into the target warehouse (AWS).
3. Analyze
Analysts search for trends using data mining, discovery or modeling tools, looking at questions such as which products are growing, where costs are rising and which customers are leaving.
4. Visualize
Findings become dashboards and graphs that busy people can read quickly. IBM lists tools such as Tableau and Cognos Analytics as examples.
5. Act
Insight only matters if it changes something. IBM's final step is an action plan: process improvements, marketing changes or customer-experience improvements.
A simple example
A retail team notices on a sales dashboard that one region's returns have climbed. Drilling into the data shows the increase is concentrated in one product line. The team investigates, changes the product description, and then watches the same dashboard to see whether returns fall. That cycle of question, data, decision and check is business intelligence in miniature. (This is an illustration of the loop, not a reported case study.)
Core Components of a Business Intelligence System
People often search for "business intelligence systems" when they want to know what the parts are. Based on the sources above, a typical BI system has these building blocks.
Data sources
Operational systems that generate data: transactions, customer records, web analytics, finance and HR systems. BI depends on them, and it can only be as good as what they contain.
ETL or ELT pipelines
The pipelines that move and prepare data. AWS notes that ELT, which loads data into the target system first and transforms it afterward, "has become more popular with the adoption of cloud infrastructure," because modern data warehouses have enough processing power to do the transformation themselves (AWS).
Data warehouse
IBM defines a data warehouse as something that "aggregates data from various sources into a central data store optimized for querying and analysis." A database mainly supports fast transaction processing for specific applications, while a warehouse integrates large volumes of data from many sources for analysis. IBM says warehouses support self-service analytics and create a "single source of truth" for reporting (IBM).
Data lakes and lakehouses
Data lakes store large amounts of raw data in many formats without a predefined structure, while warehouses clean and normalize data before storing it. IBM describes a data lakehouse as combining a lake's flexibility and cost-efficiency with a warehouse's performance (IBM). Many modern BI setups use some combination of the three. For a full comparison, see our guide to data warehouse vs data lake vs lakehouse.
OLAP and analytical queries
OLAP, or online analytical processing, is, per IBM, "technology for performing high-speed complex queries or multidimensional analysis on large volumes of data in a data warehouse, data lake or other data repository." An OLAP cube is "an array-based multidimensional database that makes it possible to process and analyze multiple data dimensions much more quickly and efficiently than a traditional relational database." Common operations include drill-down (more detail), roll-up (less detail), slice and dice (selecting parts of the cube) and pivot (rotating the view) (IBM).
Dashboards and reports
The layer people actually see. Wikipedia lists dashboards, visual reporting tools that present key metrics to decision-makers, among the key components (Wikipedia).
Governance and security
Someone must decide who can see what and which numbers are official. Without that, two dashboards can show two different answers to the same question. Data governance covers this layer: ownership, definitions, quality rules and access.
What a Business Intelligence Dashboard Shows
A business intelligence dashboard is a single screen that tracks the metrics a team cares about, usually with the ability to filter and drill down. Microsoft's documentation for Power BI illustrates the range of outputs a BI platform typically produces:
- Interactive reports and dashboards built with drag-and-drop tools.
- Paginated reports for structured, printable documents such as invoices.
- Scorecards and goals for tracking KPIs.
- Alerts and natural-language questions that let users query data in plain language (Microsoft Learn).
A useful dashboard is built around decisions, not around available data. Before building one, ask which decision it supports and who will look at it.
Cloud Business Intelligence
Many BI platforms now run in the cloud. Microsoft describes Power BI as having a desktop application for building reports and a cloud service for publishing, sharing and collaborating, plus a mobile app for viewing on the go. The desktop tool can connect to more than 100 data sources (Microsoft Learn).
Cloud business intelligence generally means that the data processing, storage or the BI application itself runs on a provider's infrastructure instead of on-premises servers. The trade-offs are the usual ones for any cloud move: easier sharing and scaling against ongoing subscription costs and a need to manage security and access carefully.
Business Intelligence vs Business Analytics
The two terms are often used interchangeably, but IBM separates them. In its view, BI is descriptive and shows what happened, for example last month's sales, while business analytics is a subset that is prescriptive and forward-looking, such as predicting which strategies would benefit the organization (IBM). Wikipedia similarly says BI focuses on reporting and dashboards, while business analytics emphasizes statistics, prediction and optimization (Wikipedia).
The two overlap, and some tools cover both. For a longer comparison, read business intelligence vs business analytics.
Business Intelligence Tools and Platforms
A business intelligence tool is software that connects to data, lets you model and explore it, and presents results as reports and dashboards. Platforms bundle several of these functions, often including data preparation, sharing and administration.
Examples named in the sources above include Tableau and Cognos Analytics (IBM) and Power BI (Microsoft). Microsoft positions Power BI as a core component of its Fabric analytics platform (Microsoft Learn). For a comparison of specific products, including pricing models and free options, see our guide to the best business intelligence tools.
When comparing tools, these questions matter more than feature lists:
- Which data sources does it connect to, and does it connect to yours?
- Who will build reports, and who will only view them?
- How does it handle security and access control?
- What does it cost at your expected number of users?
- Can non-technical staff use it without constant help?
This article does not rank products, because it relies on documentation, not hands-on testing.
Business Intelligence and AI
AI is increasingly part of BI. Microsoft's Power BI documentation lists AI features such as Copilot, described as an AI assistant for insights and report creation, and natural-language Q&A for querying data (Microsoft Learn).
Our article on AI agents for business intelligence covers the agent-style features that go beyond assistants, and the accuracy, oversight and data-access questions they raise. The practical advice is the same as for any BI output: check where the numbers came from before acting on them.
Who Uses Business Intelligence?
BI is not only for data specialists. Different groups use it in different ways, and a good setup serves all of them:
- Executives and managers look at summary dashboards to track performance against goals.
- Analysts build the reports, models and metrics, and investigate questions in more depth.
- Operational teams such as sales, support and logistics use focused views to run day-to-day work.
- Data and IT teams maintain the pipelines, warehouse, security and access that everything else relies on.
IBM notes that data warehouses support self-service analytics tools that let users explore data without technical expertise (IBM). Self-service is useful, but it works best when definitions and data quality are managed centrally.
Business Intelligence Examples by Department
The examples below are illustrations of typical questions, not reported results from any company.
| Department | A question BI can help answer | Typical data involved |
|---|---|---|
| Sales | Which products and regions are growing or shrinking? | Orders, CRM records, pricing |
| Marketing | Which channels bring customers who stay? | Campaign, web and customer data |
| Finance | Where are costs rising against budget? | Ledger, invoices, forecasts |
| Operations | Where are delays or stock shortages building up? | Inventory, shipments, supplier data |
| HR | Where is turnover highest, and is it changing? | Headcount, hiring and exit data |
| Customer support | Which issues generate the most tickets? | Ticket, chat and satisfaction data |
In each case the pattern is the same as the earlier retail example: spot a change, drill into the cause, make a decision and check whether it worked.
Benefits of Business Intelligence
IBM lists these benefits (IBM):
- Clearer reporting with data consolidated from multiple sources
- Faster decision-making based on data insights
- Increased customer and employee satisfaction
- New efficiencies and competitive advantages
These are vendor-described benefits and depend on execution. A BI project that nobody trusts or uses delivers none of them.
Limits and Risks
BI also has limits that sources often skip:
- Data quality. BI reflects the data it is given. Duplicates, gaps and inconsistent definitions produce confident-looking but wrong numbers.
- Descriptive, not predictive. Standard BI reports tell you what happened. Forecasting and optimization sit closer to analytics.
- Adoption. The best dashboard is useless if people do not open it or do not trust it.
- Governance. Without agreed definitions and access rules, teams build competing versions of the same metric.
- Cost and complexity. Tools, storage, integration work and training all add up, and costs vary widely by vendor and scale.
Building a Business Intelligence Strategy
A business intelligence strategy is a plan for how the organization will use data to make decisions. It does not need to be long. A useful one answers a few questions:
- Which decisions matter most? Start from the choices managers make, such as pricing, staffing or inventory.
- Which metrics inform them? Define each metric in plain language and say who owns it.
- Where does the data come from, and is it reliable? List the sources and their known problems.
- Who needs access to what? Set roles and permissions early.
- How will you measure success? Decide how you will know the BI work changed a decision or outcome.
- What is the first small project? Pick one question you can answer within weeks.
How to Get Started With Business Intelligence
- Pick one business question. For example, "Which channels bring in customers who stay?"
- List the data that would answer it, and where it lives.
- Clean and combine a small sample by hand or with a simple tool before building pipelines.
- Build one dashboard around that question, and show it to the people who will use it.
- Agree on definitions for each metric, so everyone reads the dashboard the same way.
- Review and expand. Once one decision has improved, add the next question. Add governance as the number of users grows: named owners, shared definitions and clear access rules.
Common Mistakes
- Starting with the tool instead of the question. Buying software before knowing which decisions it should support.
- Building dashboards nobody asked for. A dashboard designed around the data that happens to be available, not around a decision, is unlikely to be used.
- Ignoring data quality. Bad inputs spoil every chart built on them.
- No shared definitions. If "active customer" means different things to different teams, the dashboards will disagree.
- Treating BI as a one-time project. Sources, questions and people change, so reports need ongoing ownership.
- Over-trusting AI output. Verify numbers from AI features the same way you would verify any analysis.
Frequently Asked Questions
What is business intelligence in simple terms? Business intelligence is the use of technology and processes to collect, organize and analyze an organization's data so that people can make better decisions. IBM defines it as "a set of technological processes for collecting, managing and analyzing organizational data to yield insights that inform business strategies and operations" (IBM).
How does business intelligence work? It follows a loop: identify data sources, collect and clean the data (often through ETL), analyze it, visualize the results in dashboards and reports, and act on the insights (IBM).
What are the main components of a business intelligence system? Data sources, ETL or ELT pipelines, a data warehouse or lake, analytical technology such as OLAP, dashboards and reports, and governance and security.
What is the difference between business intelligence and business analytics? IBM describes BI as descriptive (what happened) and business analytics as a prescriptive, forward-looking subset. The two overlap, and some tools do both. See our guide to business intelligence vs business analytics.
What is a business intelligence dashboard? A screen that tracks key metrics, typically with filters and drill-down, so decision-makers can see how the business is performing at a glance.
What is ETL in business intelligence? Extract, transform and load: copying data from multiple sources, preparing it in a staging area and loading it into a data warehouse. AWS notes that ELT, which loads first and transforms afterward, has become more popular with cloud infrastructure (AWS).
What is cloud business intelligence? BI delivered through cloud services, where the BI application, the data storage or the processing runs on a provider's infrastructure. Power BI, for example, has a cloud service for sharing and collaboration alongside its desktop tool (Microsoft Learn).
Do small businesses need business intelligence? They can benefit from it, since the underlying habit of using data to make decisions applies at any size. A small team can start with one question and a simple dashboard instead of a full BI stack.
What are examples of business intelligence tools? Tableau, Cognos Analytics and Power BI are named in the sources used here. Other tools exist, and the right one depends on your data sources, users and budget.
Is AI replacing business intelligence? No. AI features such as natural-language questions and assistants are being added to BI platforms, but the underlying need to gather, clean and govern data remains. See AI agents for business intelligence for the details.
Where should I start? Pick one business question, identify the data that answers it, build one dashboard and agree on metric definitions before expanding.
Conclusion
Business intelligence is the discipline of turning scattered organizational data into decisions. Its core loop has been the same since the term took hold: gather data, organize it, analyze it, show it clearly and act on it. What has changed is the technology around that loop, from warehouses and OLAP cubes to cloud platforms and AI assistants.
The best way to approach it is small and practical. Start with one question, trust the data before you chart it, agree on definitions, and let a single useful dashboard earn the case for the next one. For related reading, see how BI differs from analytics, how Power BI approaches the problem, how governance keeps numbers trustworthy, and where AI agents fit in.
Sources
- IBM, What is business intelligence?
- IBM, What is a data warehouse? and What is OLAP?
- AWS, What is ETL?
- Wikipedia, Business intelligence (definition and history)
- Microsoft Learn, What is Power BI?