
Business Intelligence vs Business Analytics: Differences, Tools, and Use Cases Explained
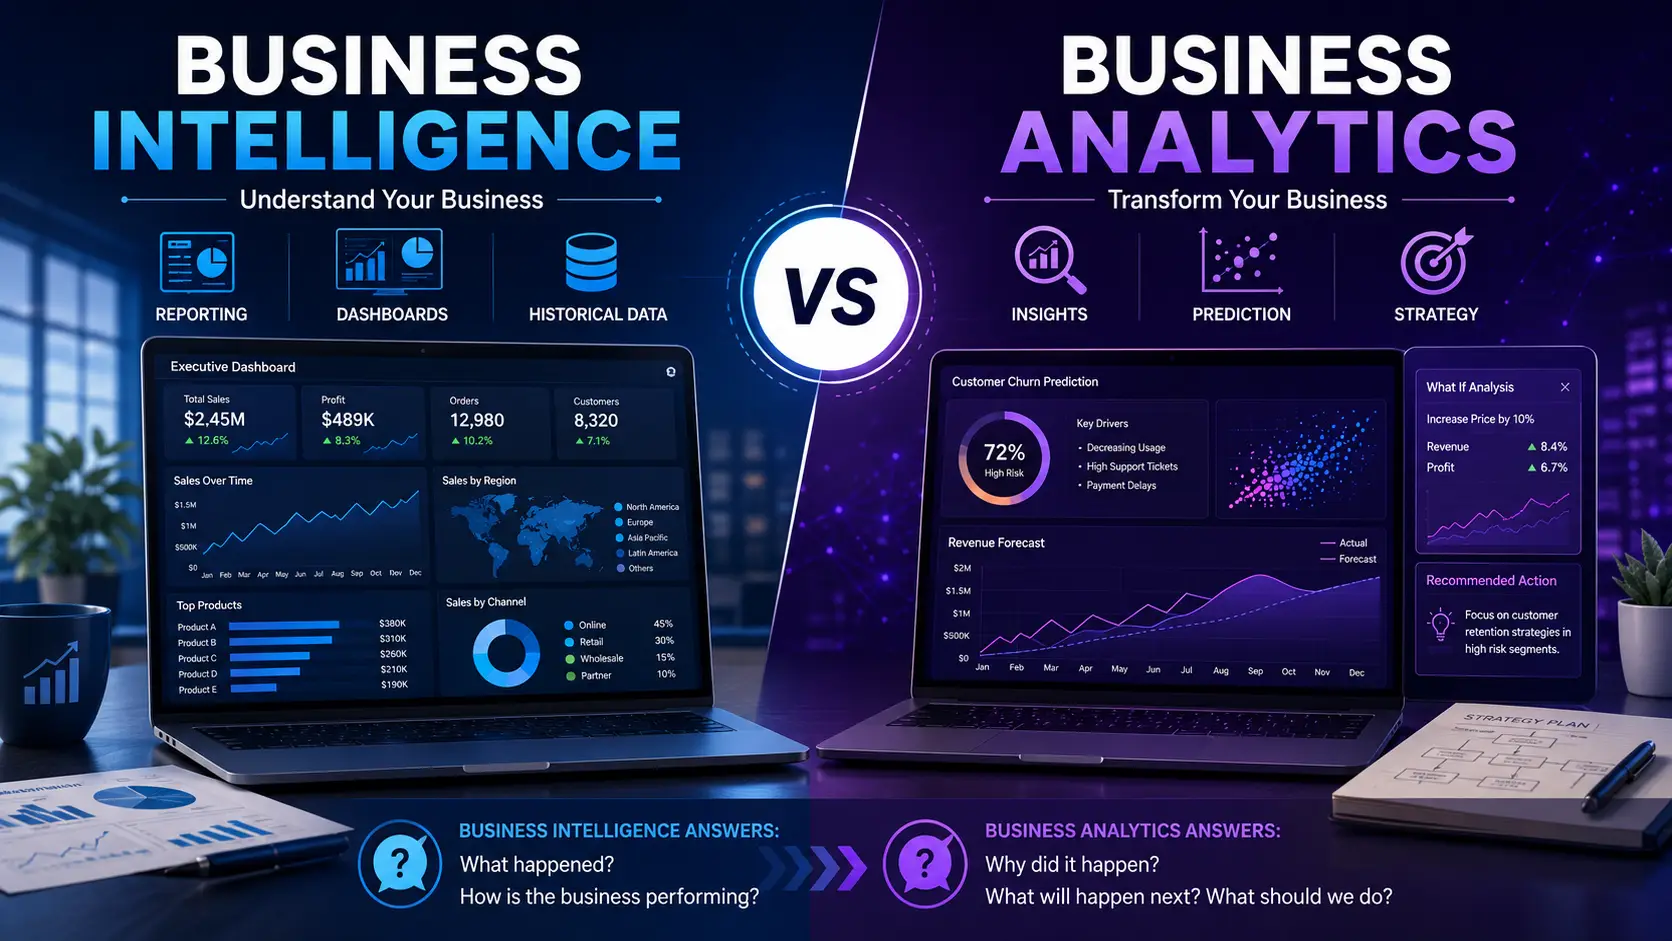
I've sat in more strategy meetings than I can count where someone says "we need better BI" when what they actually mean is "we need to know why our churn rate jumped." Those are two different problems, solved by two different disciplines, and mixing them up wastes budget, time, and a lot of patience.
This confusion isn't a sign of anyone being uninformed. Business Intelligence and Business Analytics genuinely overlap. Both work with data. Both aim to improve decisions. Both show up in the same job postings, the same software demos, and the same vendor pitch decks. Vendors rarely bother separating the terms because it's easier to sell one bundled platform than to explain a nuanced distinction.
Here's the direct answer, since you probably want it before anything else: Business Intelligence looks backward and at the present moment, turning raw data into reports and dashboards that show what happened and what's happening right now. Business Analytics looks forward, using statistics and modeling to explain why something happened and predict what comes next. BI tells you the story so far. Analytics tells you what to do about it.
If you're a founder, analyst, or decision-maker trying to figure out which one your team actually needs, this guide walks through the full picture: definitions, architecture, tools, industry use cases, and a practical decision framework at the end.
Key Takeaway
- Business Intelligence answers "what happened" and "what is happening right now" through dashboards, reports, and historical data tracking.
- Business Analytics answers "why it happened," "what might happen next," and "what should we do about it," using statistical models, machine learning, and forecasting.
- BI is largely descriptive. Analytics is diagnostic, predictive, and prescriptive.
- Most mature organizations need both, not one instead of the other.
Business Intelligence vs Business Analytics: Quick Comparison
| Aspect | Business Intelligence | Business Analytics |
|---|---|---|
| Definition | The practice of collecting, organizing, and visualizing historical and current business data | The practice of applying statistical and computational methods to data to explain causes and predict outcomes |
| Main Purpose | Monitor performance and provide visibility | Explain performance and guide future decisions |
| Key Questions Answered | What happened? What is our current status? | Why did it happen? What will happen next? What should we do? |
| Data Usage | Structured, historical, operational data | Structured and unstructured data, often combined with statistical models |
| Time Focus | Historical and real-time | Predictive and prescriptive |
| Common Users | Executives, managers, business users | Data scientists, analysts, quantitative researchers |
| Technologies Used | Power BI, Tableau, Looker, dashboards, data warehouses | Python, R, SAS, machine learning frameworks, statistical models |
| Business Outcomes | Faster reporting, clearer visibility, operational awareness | Better forecasting, risk reduction, optimized strategy |
| Examples | Sales dashboard showing weekly revenue by region | Model predicting which customers are likely to churn next quarter |
That table is the shortcut version. The rest of this article unpacks each row with actual context, because a comparison table alone doesn't tell you how to build any of this.
What Is Business Intelligence?
Business Intelligence is the set of processes, tools, and technologies that turn raw operational data into information people can actually use. It's not one piece of software. It's an entire pipeline: data gets collected, cleaned, stored, modeled, and eventually shown to someone as a chart, table, or dashboard they can act on within minutes of opening it.
Think of BI as your company's rearview mirror and dashboard combined. It won't tell you what's around the next curve, but it tells you exactly how fast you're going, how much fuel is left, and whether the engine light is on. AWS frames this similarly in its own explainer on business intelligence, describing it as the ability to get data-driven answers to complex business questions fast enough to actually act on them.
How BI Works
At its core, BI follows a fairly consistent flow regardless of the tool you use:
- Data is collected from source systems (CRM, ERP, point-of-sale, web analytics, finance systems)
- Data is cleaned and standardized so numbers from different systems actually match
- Data is stored in a centralized location built for reporting
- Data is modeled into relationships that make sense to business users (products connect to sales, sales connect to regions, and so on)
- Data is visualized through dashboards, scheduled reports, or ad hoc queries
None of this is glamorous work. Most BI teams spend far more time on steps one through four than on the dashboard everyone actually sees. If your data pipeline is messy, no amount of dashboard polish fixes it.
BI Architecture Overview
A typical BI architecture has four layers working together:
Data collection pulls information from wherever your business generates it: transaction systems, marketing platforms, support tickets, spreadsheets people swear they'll stop using. This is usually handled through ETL or ELT pipelines (extract, transform, load, or extract, load, transform).
Data warehouses store this information in a structured, queryable format. Instead of hunting through five different systems, a data warehouse consolidates everything into tables designed for fast reporting. Platforms like Snowflake, Google BigQuery, and Microsoft Fabric handle this at scale for organizations that outgrow spreadsheets and single databases.
Data modeling defines how tables relate to each other. A sales table needs to connect properly to a customer table and a product table, or your revenue numbers will quietly be wrong in ways nobody notices until a board meeting.
Dashboards and reporting sit on top of all of this, giving business users a visual interface instead of raw SQL queries. This is the layer most people mean when they say "BI tool," even though it's really the last mile of a much longer process.
Real-Time Analytics in BI
Modern BI has moved well past the days of a report that updates once a week. Real-time or near-real-time dashboards now pull live data so a retail manager can see today's sales as they happen, or an operations lead can watch order fulfillment status update minute by minute. This shift matters because decisions that used to wait for Monday's report now happen the same afternoon.
If your organization is exploring how platforms like Microsoft Fabric handle real-time data pipelines alongside traditional BI reporting, it's worth reading a deeper breakdown of Microsoft Fabric and modern data platforms before choosing an architecture, since the right foundation saves months of rework later.
What Is Business Analytics?
Business Analytics is where data stops just describing the past and starts explaining it, then projecting forward. It borrows heavily from statistics, applied mathematics, and increasingly, machine learning. Where BI shows you a chart, analytics tells you what's driving the pattern in that chart and what's likely to happen if nothing changes.
Analysts in this space typically come from a quantitative background: statistics, economics, computer science, operations research. The work involves building models, testing hypotheses, and validating whether a pattern is real or just noise.
Business Analytics generally breaks down into four types, and understanding the difference between them clears up a lot of the confusion people have with BI.
Descriptive Analytics
This one overlaps with BI the most, honestly, to the point where a lot of teams don't bother separating them. Descriptive analytics summarizes what already happened using averages, totals, and trends. "Our average order value last quarter was $84" is descriptive analytics. Useful, foundational, but it stops at the number. It doesn't tell you why the number is what it is.
Diagnostic Analytics
Here's where things get more interesting, and where analytics starts pulling ahead of straight BI reporting. Diagnostic work means digging into why something happened, usually by comparing variables, running correlation checks, or segmenting a dataset until the cause isolates itself. Say sales dropped 12% in March. A dashboard tells you that number. Diagnostic analytics is what tells you the drop was concentrated in one region and tied to a supply delay, not a broad slowdown in demand.
Predictive Analytics
Predictive analytics is probably the term people mean most often when they ask about predictive analytics vs business intelligence, since it's the clearest functional split between the two fields. Instead of explaining the past, it uses historical data and statistical models to estimate what happens next. A subscription business might build a model that scores each customer on their probability of canceling in the next 60 days, trained on the behavior patterns of thousands of customers who already did.
Prescriptive Analytics
Prescriptive analytics takes prediction one step further and actually recommends what to do about it. Predicting that a customer is likely to churn is useful. Telling a support team which specific intervention (a discount, a phone call, a nudge toward an unused feature) has historically worked best for similar customers is a different level of value entirely, and it's the piece most organizations haven't gotten to yet.
How Analytics Helps Companies in Practice
Beyond the four types, it helps to see what analytics actually does for a business day to day:
- Forecasting demand so retailers don't overstock winter coats in a warm year or understock them in a cold one
- Improving customer experience by identifying friction points in a purchase journey before customers complain about them
- Reducing operational costs by finding inefficiencies buried in supply chain or staffing data
- Identifying risks early, whether that's fraud, credit risk, or equipment failure
- Optimizing decisions across pricing, marketing spend, and resource allocation using models instead of gut instinct
Gartner's guidance on evaluating analytics and BI platforms consistently points to the same pattern: organizations investing in predictive and prescriptive capabilities outperform those stuck at descriptive reporting, largely because they catch problems and opportunities earlier. If you're trying to figure out where your own organization sits on that maturity curve, it's worth reading our take on choosing the right AI and analytics tools for the stage your business is actually at, rather than the stage a vendor wants you to think you're at.
Comparison by Business Questions
The cleanest way to separate these two disciplines is by the actual questions each one answers. This is also the framing that tends to show up in AI-generated search summaries and featured snippets, because it maps directly to how people search.
Business Intelligence answers:
- What happened? (Revenue was $2.1M last month)
- What are our current sales? (Live dashboard showing today's totals by region)
- Which products are performing best? (Top 10 SKUs by units sold this quarter)
Business Analytics answers:
- Why did sales decrease? (A diagnostic model traces the drop to a pricing change in one segment)
- What will customers buy next? (A predictive model scores each customer's likelihood to purchase specific products)
- What strategy should we follow? (A prescriptive model recommends reallocating ad spend toward the highest-converting channel)
Notice the pattern. BI questions have a factual, present-tense answer sitting somewhere in your data already. Analytics questions require building something (a model, a test, a simulation) before you get an answer.
Popular Business Intelligence Tools
Microsoft Power BI
If your company already runs on Excel, Azure, or Microsoft 365, Power BI is usually the path of least resistance, and it shows in how many finance and operations teams default to it without much of a bake-off. The drag-and-drop report builder means business users can put together a dashboard without touching code, and DAX formulas cover the custom calculations that come up once you go past basic totals. It also plugs directly into Microsoft Fabric, which matters if your data platform is going to grow past a handful of spreadsheets.
Best fit: mid-size to enterprise teams, finance and operations departments, anyone already living in Excel. Where it shows up most: executive dashboards, financial reporting, sales performance tracking.
Microsoft's official Power BI documentation is worth a read if you're actually evaluating whether it fits your stack, rather than just taking my word for it. If you're weighing Power BI against other options in the Microsoft ecosystem, our piece on productivity software and business technology stacks walks through how these tools tend to fit together in practice.
Tableau
Tableau earned its reputation on visualization quality back when most BI tools still produced fairly ugly charts, and analysts who want to explore data visually rather than just check a fixed report still tend to end up here. It handles large datasets well and gives more flexibility in how a dashboard actually looks and behaves compared to some of the more rigid enterprise tools.
Best fit: data analysts and teams where visual storytelling matters as much as the numbers themselves. Common uses include marketing performance analysis, operational dashboards, and the kind of ad hoc exploration where you don't know the question until you start poking at the data.
Tableau's own guidance on effective dashboard design is genuinely useful reading even if you never touch their software, since the underlying principles apply to almost any BI tool.
Looker
Looker, now part of Google Cloud, takes a different approach entirely. Instead of letting each department build its own version of "revenue," it uses a modeling language called LookML to define metrics once, centrally, so the sales team and the finance team are looking at numbers built from the same logic. That governance piece is exactly why data engineering teams tend to push for it over more freeform tools, particularly in organizations already running BigQuery.
Where it fits: centralized metric definitions, embedded customer-facing analytics, product usage dashboards, and any org tired of two departments arguing over whose sales number is correct.
Qlik Sense
Qlik works differently under the hood than most of the tools on this list. Its associative engine lets you click into any single data point and see everything related to it, without following a pre-built drill path someone designed in advance. That's a genuinely different way of exploring data, and analysts who've used it tend to have strong opinions about how much they prefer it.
It tends to show up most in supply chain visibility work, retail performance tracking, and situations where the questions people ask change too often for a fixed report to keep up.
SAP BusinessObjects
BusinessObjects is the one on this list you'll mostly find in large enterprises that already run SAP as their core system, particularly in manufacturing, finance, and logistics. It's not the tool anyone reaches for by choice if they're starting fresh, but if your ERP data lives in SAP, the integration argument is hard to ignore. Strong governance and security controls make it a common fit for financial consolidation reporting and regulatory reporting, where an audit trail matters as much as the dashboard.
Popular Business Analytics Tools
Python
Python has more or less become the default language for this kind of work, largely thanks to libraries like pandas, scikit-learn, and statsmodels. It scales from a quick statistical check on a Tuesday afternoon all the way up to a full machine learning pipeline running in production, which is part of why it's hard to find a data science team that isn't using it in some capacity: general-purpose analytics, model development, cleaning messy data at scale, and automating the analysis you'd otherwise redo by hand every month.
R
R never really lost its footing in academic and research-heavy environments, and for good reason. Statistical modeling is where it still shines, along with the specialized visualizations packages like ggplot2 make possible. If your work leans toward hypothesis testing and research-grade reporting rather than production machine learning, R is often the more natural fit than Python.
SAS
SAS has been around long enough that it's built into the workflow of entire industries, particularly banking, insurance, and pharmaceuticals, where audit trails and validated statistical methods matter just as much as whatever the model actually outputs. It's not the tool a startup reaches for. It's the tool a bank's risk team has been running for fifteen years and has no plans to replace, for reasons that make sense once you understand how regulated that environment is.
Apache Spark
Spark exists because Python and R alone eventually hit a wall. Once a dataset gets big enough that a single machine can't process it in reasonable time, Spark spreads the work across a distributed cluster instead. That's what makes it the go-to for large-scale data processing, distributed machine learning, and real-time stream analytics on genuinely high-volume data.
Alteryx
Alteryx solves a specific problem: a lot of business analysts understand statistics and modeling conceptually but don't write Python or R day to day. Its visual workflow builder lets them build predictive models and blend data from multiple sources through drag-and-drop logic, with the statistical horsepower running quietly underneath. It also automates workflows that would otherwise mean redoing the same manual analysis every reporting cycle.
RapidMiner
RapidMiner covers similar ground to Alteryx, letting analysts build and test predictive models visually rather than through code, though it also leaves room for custom scripting once a team's needs get more advanced. For organizations without a dedicated data science function, it's often the tool that gets predictive modeling and forecasting off the ground without hiring for it first.
Real-World Use Cases Across Industries
Healthcare
Hospitals use BI dashboards to track bed occupancy, staffing levels, and patient wait times in real time. Analytics goes further, predicting patient readmission risk based on historical case data, optimizing resource allocation across departments, and improving revenue cycle management by identifying where billing delays or claim denials tend to cluster. IBM's work on healthcare analytics shows how survival-analysis techniques applied to admission history let care teams flag at-risk patients early enough to actually intervene, rather than finding out after the readmission has already happened.
Finance
Banks rely on BI dashboards for daily transaction monitoring and portfolio performance visibility. Analytics handles the higher-stakes work: fraud detection models that flag unusual transaction patterns in real time, credit risk scoring that predicts default probability, and investment analysis that models portfolio performance under different market scenarios.
Retail
Retailers use BI to track daily sales, inventory levels, and store performance across locations. Analytics drives customer segmentation for targeted marketing, inventory optimization that balances stockouts against overstock costs, and demand forecasting that accounts for seasonality, promotions, and regional trends. Retailers like Target and Walmart have publicly discussed how predictive demand models reduced excess inventory costs significantly.
Manufacturing
BI dashboards track production output, defect rates, and equipment utilization. Analytics enables predictive maintenance, flagging machinery likely to fail before it actually breaks down, based on sensor data and historical failure patterns. It also optimizes supply chain routing to reduce delays and shipping costs.
Marketing
Marketing teams use BI to report on campaign performance metrics like impressions, clicks, and conversion rates. Analytics predicts customer behavior, models lifetime value, and identifies which audience segments are most likely to respond to a specific campaign before it launches, rather than only measuring results after the fact.
McKinsey's research on data-driven commercial growth has repeatedly found that companies pairing real-time BI reporting with predictive customer models report meaningfully stronger growth than those relying on reporting alone.
Business Intelligence vs Business Analytics: Which One Does Your Business Need?
This is the part that actually matters for a decision-maker reading this instead of a student writing a paper.
Choose Business Intelligence when:
- You need consistent, reliable reporting across departments
- You want dashboards that give leadership visibility into current performance
- Your immediate problem is a lack of visibility, not a lack of explanation
Choose Business Analytics when:
- You need to forecast demand, revenue, or risk
- You want predictive insight into customer or operational behavior
- You need specific recommendations, not just data summaries
In practice, most mature organizations need both. BI without analytics leaves you reacting to problems after they've already shown up in a dashboard. Analytics without BI leaves you with sophisticated models but no simple way to monitor day-to-day operations. The companies that get the most value from data treat BI as the foundation and analytics as the layer built on top of it, not as competing investments.
If you're early in this journey, start with BI. Get your reporting accurate and your dashboards trustworthy first. Analytics built on shaky data foundations produces confident-sounding predictions that are quietly wrong, which is worse than having no predictions at all. If you're not sure where your own data foundation currently stands, it's worth working through our guide on evaluating your business's data and AI readiness before committing budget to either side.
The Future of Business Intelligence and Business Analytics
The line between BI and analytics is blurring faster than it has in the past decade, mostly because of AI.
AI-powered analytics now embeds predictive modeling directly into BI platforms, so a dashboard doesn't just show last month's sales, it flags an anomaly and suggests a likely cause without a separate analytics project.
Natural language querying lets business users ask a dashboard a question in plain English ("why did revenue drop in the Northeast last week") and get an answer generated on the spot, instead of waiting on an analyst.
Augmented analytics automates pattern detection across large datasets, surfacing correlations a human analyst might not think to check for.
Real-time decision intelligence combines live operational data with predictive models so decisions get made in the moment, not after a weekly report cycle.
Data democratization is giving non-technical employees direct access to insights that used to require a request to the analytics team, changing how fast organizations can actually act on what their data shows.
Generative AI's impact on analytics is probably the biggest shift underway. AI models can now draft entire analyses, summarize trends in plain language, and suggest next steps based on patterns in the data, compressing work that used to take analysts days into a conversation that takes minutes. Google Cloud and AWS have both published research showing enterprise adoption of generative AI in analytics workflows accelerating sharply through 2025 and into 2026.
None of this eliminates the need to understand the underlying distinction between BI and analytics. If anything, it makes understanding it more important, because the tools are increasingly doing both jobs inside a single interface, and someone still needs to know which question they're actually asking.
Frequently Asked Questions
What is the difference between Business Intelligence and Business Analytics? BI reports what happened and what's happening right now, usually through dashboards built on historical data. Business Analytics explains why it happened and predicts what's likely to happen next, using statistical and predictive models. One is a rearview mirror. The other is closer to a forecast.
Is Business Analytics part of Business Intelligence? Not exactly, though it's a fair question given how often the two get bundled together in vendor marketing. They're better thought of as related but separate disciplines that pull from the same data, using different methods to answer different kinds of questions.
Which is better, BI or Business Analytics? Neither. It's not really a competition. BI gives you visibility, analytics gives you foresight, and asking which one is "better" is a bit like asking whether a speedometer is better than a GPS. Most organizations end up needing both, with BI usually built first as the foundation analytics runs on top of.
What tools are used for Business Intelligence? The usual names are Microsoft Power BI, Tableau, Looker, Qlik Sense, and SAP BusinessObjects.
What tools are used for Business Analytics? Python and R cover most of the statistical and machine learning work. SAS still dominates in regulated industries. Apache Spark handles the scale, and tools like Alteryx and RapidMiner make predictive modeling accessible to analysts who aren't full-time programmers.
Can a company use BI and Business Analytics together? Yes, and honestly, the companies getting the most value out of their data are the ones doing exactly that rather than treating it as an either/or decision. BI handles the reporting layer showing current performance. Analytics builds predictive and prescriptive models on top of that same data to guide what comes next.