
17 Best Data Analysis Tools in 2026 (Free & Paid Compared)
Quick Answer
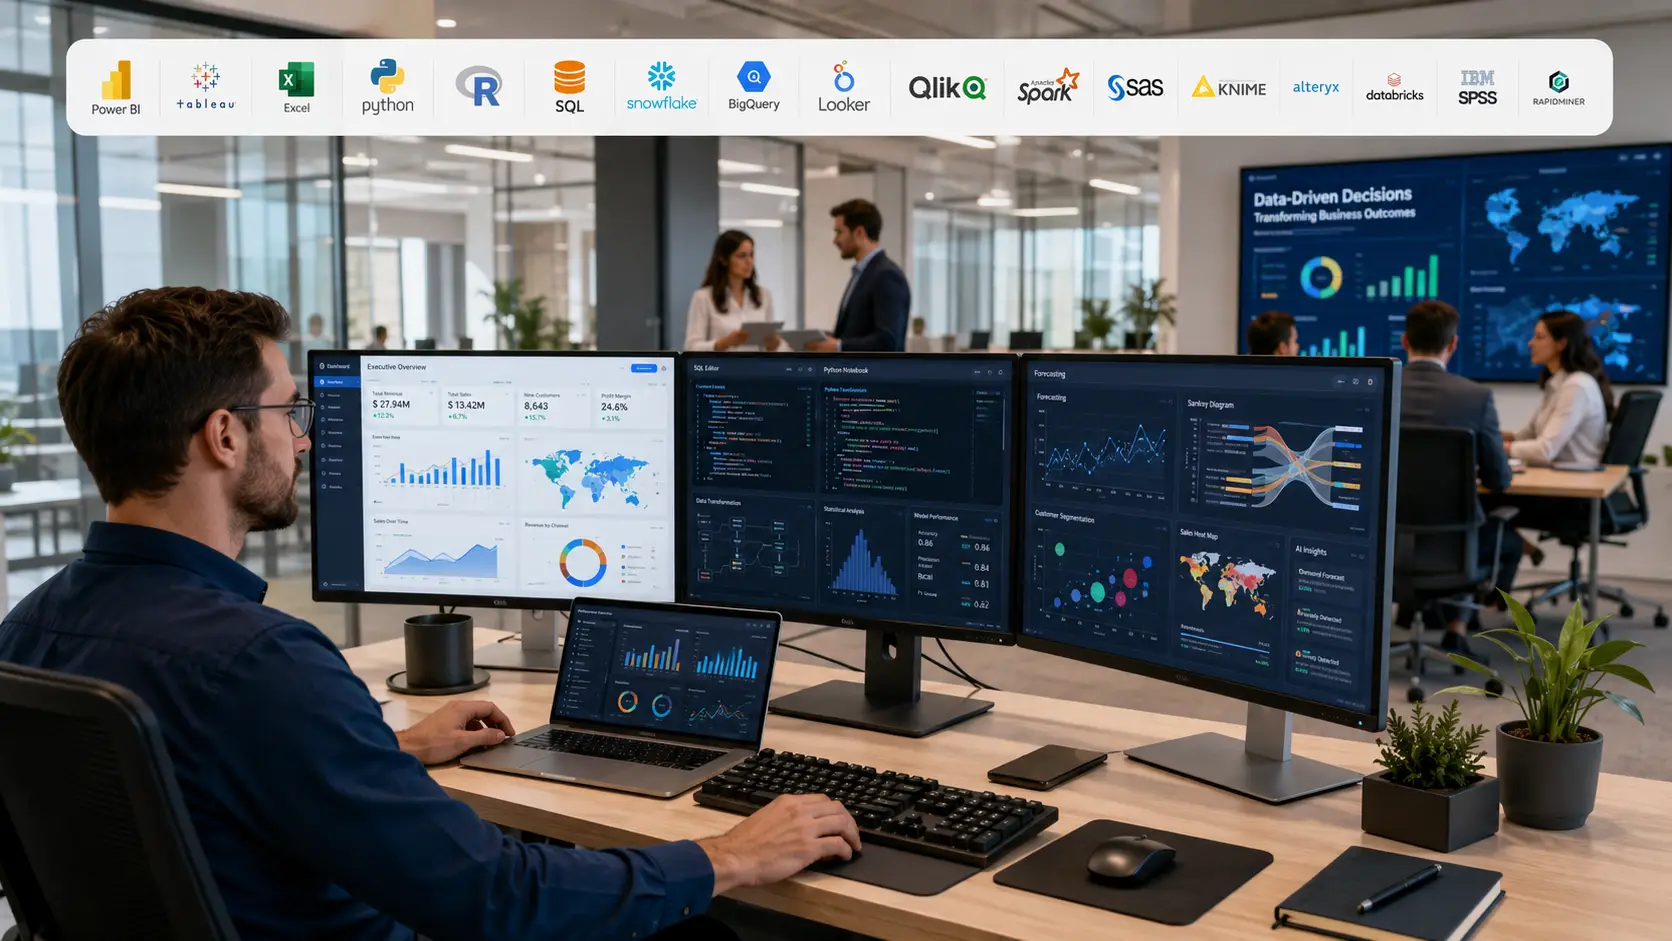
The best data analysis tools in 2026 are Microsoft Power BI and Tableau for business intelligence and dashboards, Python and R for statistical modeling and data science, SQL for querying structured data, Excel for quick, everyday analysis, and Snowflake or Databricks for large-scale enterprise data platforms. There is no single "best" tool - the right choice depends on your data volume, your team's coding comfort, and whether you need visualization, statistical modeling, or large-scale data engineering.
If you want a one-line recommendation: beginners and small businesses should start with Excel or Power BI, growing teams should adopt Power BI or Tableau alongside SQL, and data science teams should standardize on Python with a cloud warehouse like Snowflake or Databricks.
Comparison Table: 17 Best Data Analysis Tools at a Glance
| Tool | Best For | AI Features | Free Plan | Ease of Use | Platform |
|---|---|---|---|---|---|
| Power BI | Business intelligence & dashboards | Copilot, Q&A natural language | Yes (Desktop, no sharing) | Moderate | Windows, Web, Cloud |
| Tableau | Advanced data visualization | Tableau Agent, Pulse | Yes (Public, no privacy) | Moderate–Hard | Windows, Mac, Web, Cloud |
| Microsoft Excel | Everyday spreadsheet analysis | Copilot in Excel | Limited (Excel Online) | Easy | Windows, Mac, Web |
| Python | Data science, ML, automation | Via libraries (scikit-learn, PyCaret) | Yes, fully free | Hard | Windows, Mac, Linux |
| R | Statistical analysis & research | Via packages (tidymodels) | Yes, fully free | Hard | Windows, Mac, Linux |
| SQL | Querying & structured data | AI query generation (Copilot, Cortex) | Yes (engine-dependent) | Moderate | Cross-platform |
| Looker Studio | Free marketing/web dashboards | Gemini-assisted formulas | Yes, fully free | Easy | Web |
| Apache Spark | Big data processing | MLlib, integrates with AI frameworks | Yes, fully free | Hard | Cross-platform, cloud |
| Snowflake | Cloud data warehousing | Cortex AI, Copilot | Trial credits only | Moderate | Cloud (multi-cloud) |
| Databricks | Unified data + AI/ML platform | Databricks Assistant, AutoML | Free Edition | Hard | Cloud (multi-cloud) |
| IBM SPSS | Academic & survey statistics | AI-guided statistics | Trial | Easy–Moderate | Windows, Mac |
| Alteryx | Data blending & prep automation | AI-assisted workflows, AiDIN | Trial only | Moderate | Windows, Cloud |
| Qlik Sense | Associative data exploration | Qlik Answers, Qlik Predict | Trial | Moderate | Web, Cloud |
| KNIME | Visual, no-code data workflows | AI extensions, K-AI assistant | Yes, fully free | Moderate | Windows, Mac, Linux |
| RapidMiner (Altair AI Studio) | Predictive modeling, no-code ML | Auto Model, AI assistant | Free (limited rows) | Moderate | Windows, Mac, Linux |
| Grafana | Real-time monitoring dashboards | Grafana ML, anomaly detection | Yes, fully free | Moderate | Web, self-hosted |
| SAS | Enterprise statistical modeling | SAS Viya AI/ML, Copilot | SAS OnDemand for Academics | Moderate–Hard | Windows, Cloud |
How to Think About Choosing a Tool
A data analysis tool rarely fails on its own. The usual problem is a mismatch between the tool and the team. A small startup that buys an enterprise analytics platform because a competitor uses it can end up with an unused line item and weeks of onboarding. A large organization that runs critical reporting out of shared spreadsheets can end up one mistyped formula away from a wrong number that many people rely on. These are illustrations of common risks, not accounts of specific companies.
So this guide does not try to crown one winner. It helps you match your situation, including team size, data volume, technical skill and budget, to the tool that will actually be used six months from now.
What Is a Data Analysis Tool?
A data analysis tool is software that helps you collect, clean, explore, visualize, and interpret data to answer a specific business or research question. That's a broad definition on purpose, because the category spans spreadsheet software (Excel), business intelligence platforms (Power BI, Tableau), programming languages (Python, R), query languages (SQL), and full data platforms (Snowflake, Databricks).
What separates a "data analysis tool" from a database or a spreadsheet is the analytical layer: statistical functions, visualization engines, modeling capabilities, or automated insight generation built on top of raw data storage. In 2026, most tools in this category also include some form of AI assistance - natural-language querying, automated anomaly detection, or AI-generated summaries - which has become an expected feature rather than a premium add-on.
The right tool depends less on what the software can theoretically do and more on who's using it, how often, and on what kind of data.
How the Tools Were Compared
The tools are compared on the ten criteria below. These are editorial judgments based on each vendor's documentation and public information, not benchmark scores or the result of hands-on testing, and you should weight them according to your own situation.
| Criterion | What We Looked At |
|---|---|
| Ease of use | Time for a new analyst to build a first working report or query |
| Learning curve | How steep the path is from "beginner" to "independent power user" |
| Visualization | Chart variety, interactivity, and customization depth |
| AI capabilities | Natural-language querying, auto-insights, AI-assisted modeling |
| Scalability | Performance on datasets from a few thousand rows to billions |
| Integrations | Native connectors to databases, cloud platforms, and other BI tools |
| Pricing transparency | Whether real costs are published or hidden behind "contact sales" |
| Support quality | Documentation depth, community size, response times |
| Enterprise readiness | Governance, row-level security, audit logs, SSO |
| Performance | Query speed and responsiveness under realistic data loads |
Feature and pricing information comes from each vendor's official documentation and pricing pages. Prices were checked in October 2026 where the vendor's page was available, and each entry says when a price comes from the vendor's page, when it is only reported elsewhere, and when the vendor does not publish a price. Plans change often, so confirm current prices before you buy.
The 17 Best Data Analysis Tools in 2026
1. Microsoft Power BI
Overview: Power BI is Microsoft's business intelligence platform, and it's the default choice for organizations already living inside Microsoft 365, Azure, or the broader Fabric ecosystem. Full technical detail lives in Microsoft Learn's Power BI documentation. It connects to virtually any data source, builds interactive dashboards fast, and - since the April 2025 price increase - costs $14 per user/month for Pro and $24 for Premium Per User, per Microsoft's official Power BI pricing page.
Best For: Business intelligence, executive dashboards, teams already using Microsoft 365.
Key Features: Drag-and-drop report builder, DAX formula language, Power Query for data transformation, Microsoft Fabric integration, Direct Lake mode for near-instant queries on OneLake data.
AI Features: Copilot in Power BI can generate report summaries and DAX measures from plain-English prompts; Q&A lets viewers type questions and get auto-generated visuals.
Pros:
- Lowest entry price among major enterprise BI platforms
- Deep integration with Excel, Teams, and SharePoint
- Massive connector library and active community
Cons:
- Licensing model gets genuinely confusing once you factor in Pro, PPU, and Fabric capacity tiers
- DAX has a real learning curve for anyone without a SQL or Excel-formula background
- Report viewers typically still need paid licenses unless you're on F64+ Fabric capacity
Pricing: Free (Desktop, no sharing); Pro $14/user/month; Premium Per User $24/user/month; Fabric capacity is priced separately and scales with compute. Pro and Premium Per User prices are from Microsoft's pricing page (October 2026). Check it for current rates, since Microsoft has changed this structure before.
Supported Platforms: Windows desktop, web browser, Power BI mobile apps.
Integrations: Excel, SQL Server, Azure, Salesforce, Google Analytics, SAP, Snowflake, and 100+ native connectors.
Who Should Use It: Any organization already on Microsoft 365 that needs shared dashboards without a huge new vendor relationship.
Who Should Avoid It: Mac-only shops (Desktop is Windows-only) and teams that need best-in-class custom visualization rather than fast, standard dashboards.
Editorial note: Power BI wins on total cost of ownership more often than any other tool on this list, but the licensing model punishes organizations that don't plan their user tiers carefully. Budget time for a proper Pro-vs-PPU-vs-Fabric conversation before you buy, not after.
2. Tableau
Overview: Tableau, now owned by Salesforce, remains the gold standard for visual, exploratory data analysis. Where Power BI optimizes for speed and standardization, Tableau optimizes for visual flexibility and depth of interaction. Full product documentation is available through Tableau's official help portal, and current plan details are on Tableau's official pricing page.
Best For: Teams that need highly customized, exploratory dashboards and have analysts willing to invest in learning the platform.
Key Features: Drag-and-drop visual builder, Tableau Prep for data cleaning, Tableau Pulse for automated metric tracking, extensive chart-type library.
AI Features: Tableau Agent supports natural-language questions inside dashboards; Tableau Next introduces agentic analytics for more autonomous insight generation (contact sales for pricing).
Pros:
- Best-in-class visualization flexibility and polish
- Strong community and certification ecosystem
- Tableau Public offers a genuinely useful free option for portfolio-building
Cons:
- Steeper learning curve than Power BI for non-technical users
- Per-user pricing climbs fast once you need Explorer and Creator seats across a team
- No true white-label option even on Enterprise tiers
Pricing: Public free tier (dashboards are public); Viewer $15/user/month; Explorer $42/user/month; Creator $75/user/month, billed annually (Standard edition; Enterprise edition runs higher). These figures are as reported; Tableau's pricing page blocked my fetch, so confirm them there. Tableau+ AI bundle pricing requires contacting sales.
Supported Platforms: Windows, Mac, web, Tableau Cloud, Tableau Server (self-hosted).
Integrations: Salesforce, Snowflake, Google BigQuery, Amazon Redshift, and hundreds of native connectors.
Who Should Use It: Data teams whose primary output is polished, interactive dashboards for stakeholders who ask a lot of "what if" questions.
Who Should Avoid It: Small teams without a dedicated analyst - Tableau rewards ongoing investment and punishes casual, occasional use.
Editorial note: If your team's bottleneck is "the chart doesn't look the way I need it to," Tableau solves that better than anything else here. If your bottleneck is "we don't have anyone who can build dashboards," Tableau will not fix that - it'll just be a more expensive version of the same problem.
3. Microsoft Excel
Overview: Excel remains the most-used data analysis tool on Earth, and for good reason - it's already installed, everyone already sort-of knows it, and it can genuinely handle a surprising amount of real analytical work through pivot tables, formulas, and Power Query. Microsoft's Excel documentation on Microsoft Learn covers the formula library and Power Query in depth.
Best For: Quick analysis, small datasets, financial modeling, and any task where the "tool" isn't the point.
Key Features: Pivot tables, Power Query, Power Pivot, conditional formatting, a formula library covering everything from lookups to statistical functions.
AI Features: Copilot in Excel can write formulas, generate charts, and summarize datasets from natural-language prompts.
Pros:
- Nearly universal familiarity - minimal training required
- Power Query and Power Pivot make it far more capable than people expect
- Included in most existing Microsoft 365 subscriptions
Cons:
- Breaks down on large datasets (millions of rows) or with multiple simultaneous editors
- Version control and audit trails are weak compared to purpose-built BI tools
- Easy to introduce silent formula errors that go unnoticed for months
Pricing: Included with Microsoft 365 Personal, Business, or Enterprise plans; limited free version via Excel Online. Check Microsoft's current Microsoft 365 pricing page, as bundling changes periodically.
Supported Platforms: Windows, Mac, web, mobile.
Integrations: Power BI, SharePoint, Power Automate, and (via Power Query) most major databases and APIs.
Who Should Use It: Anyone doing ad hoc analysis, financial modeling, or small-to-mid-size dataset work.
Who Should Avoid It: Teams managing datasets that need to be queried by many people simultaneously, or where a single wrong formula could have compliance consequences.
Editorial note: Excel is the tool people love to dismiss, yet it is widely used for real analytical work. The mistake isn't using Excel. It is using Excel past the point where something more governed is needed.
4. Python
Overview: Python is the dominant programming language for data science, statistical modeling, and machine learning, largely thanks to its readable syntax and an enormous open-source ecosystem (pandas, NumPy, scikit-learn, Matplotlib). According to the Stack Overflow Developer Survey, Python consistently ranks among the most-used and most-admired languages among data professionals.
Best For: Data science, machine learning, automation, and reproducible statistical analysis.
Key Features: pandas for data manipulation, scikit-learn and PyTorch for machine learning, Jupyter Notebooks for interactive analysis, Matplotlib/Seaborn/Plotly for visualization.
AI Features: No built-in AI assistant, but it's the language most AI/ML frameworks (TensorFlow, PyTorch, Hugging Face) are built on - it's the tool you'd use to build the AI features other platforms ship.
Pros:
- Completely free and open source
- The largest library ecosystem of any data analysis language
- Skills transfer directly into machine learning and software engineering roles
Cons:
- Requires actual coding knowledge - no visual interface out of the box
- Environment and dependency management (virtual environments, package versions) trips up beginners
- No built-in governance or sharing layer; you need separate infrastructure to distribute results
Pricing: Free, per the Python Software Foundation.
Supported Platforms: Windows, Mac, Linux, cloud notebooks (Google Colab, Databricks, Kaggle).
Integrations: Connects to virtually every database, API, and cloud platform via libraries; integrates with Power BI and Tableau for advanced scripted visuals.
Who Should Use It: Data scientists, analysts doing statistical modeling, and anyone building repeatable, automated analysis pipelines.
Who Should Avoid It: Business users who need a dashboard by Friday and have never written a line of code.
Editorial note: If you're hiring your first data analyst and want that hire to have a long career runway, Python is the safer long-term investment over a proprietary BI tool - the skills are portable, the tool is free, and the ecosystem isn't going anywhere.
5. R
Overview: R was purpose-built for statistics by statisticians, and it still shows - few tools match its depth for rigorous statistical modeling, hypothesis testing, and academic research. The R Project and its CRAN package repository remain a cornerstone of academic and pharmaceutical data analysis.
Best For: Statistical research, academic analysis, biostatistics, and specialized statistical modeling.
Key Features: The tidyverse (dplyr, ggplot2, tidyr), thousands of statistical packages via CRAN, R Markdown for reproducible reports, Shiny for interactive web apps.
AI Features: The tidymodels framework supports machine learning workflows, and R integrates with AI APIs, though it's not the primary language for LLM-based tooling the way Python is.
Pros:
- Unmatched depth of statistical methods and packages, many written by the researchers who invented the methods
- ggplot2 produces some of the most polished statistical graphics available in any tool
- Completely free and open source
Cons:
- Steeper learning curve than Python for general-purpose programming tasks
- Smaller overall job market and AI/ML ecosystem than Python
- Memory management can be a real constraint on very large datasets without extra tooling
Pricing: Free, distributed by the R Project.
Supported Platforms: Windows, Mac, Linux, RStudio (desktop and cloud).
Integrations: Connects to SQL databases, integrates with Python via reticulate, works inside Databricks and Posit Cloud.
Who Should Use It: Statisticians, academic researchers, and biostatistics or clinical-trial teams that need methodological rigor above all else.
Who Should Avoid It: General business analysts who mainly need dashboards, or teams that plan to eventually deploy models into production software (Python has stronger production tooling).
Editorial note: R still quietly runs a huge share of the world's peer-reviewed statistical research. If your work will be scrutinized by a journal reviewer or a regulatory body, R's statistical package depth is hard to beat.
6. SQL
Overview: SQL (Structured Query Language) isn't a tool so much as the shared language nearly every data platform on this list eventually requires. Whether you're querying Snowflake, Power BI's data model, or a Postgres database, SQL is how you get data out. The core syntax is governed by an ISO/ANSI standard, though most analysts learn it through engine-specific documentation such as PostgreSQL's official documentation or Microsoft's T-SQL reference.
Best For: Querying and filtering structured data stored in relational databases and data warehouses.
Key Features: SELECT/JOIN/GROUP BY querying, window functions, common table expressions (CTEs), stored procedures.
AI Features: Most modern platforms (Snowflake Cortex, Databricks Assistant, Microsoft Copilot) can now generate SQL from natural-language prompts, dramatically lowering the barrier to entry.
Pros:
- Universal - every relational database and most cloud warehouses speak SQL
- Relatively fast to learn the basics compared to a general-purpose programming language
- Directly transferable across Snowflake, BigQuery, Redshift, Postgres, MySQL, and SQL Server
Cons:
- Syntax and functions vary slightly by database engine (T-SQL vs PostgreSQL vs Snowflake SQL)
- Not designed for statistical modeling or visualization on its own
- Complex analytical queries can become genuinely hard to read and maintain
Pricing: Free - it's an open, ANSI-standardized query language, though the databases running it may charge for compute or storage.
Supported Platforms: Cross-platform; runs inside virtually every database engine and cloud data warehouse.
Integrations: Native to Power BI, Tableau, Excel (via Power Query), Python (via SQLAlchemy), and R (via DBI).
Who Should Use It: Every data analyst, full stop. SQL literacy is now a baseline expectation, not a specialization.
Who Should Avoid It: No one - even if you primarily use a no-code tool, understanding SQL will make you meaningfully better at it.
Editorial note: SQL fluency transfers across almost every tool in this guide, which makes it a safer investment than expertise in any single BI product.
7. Looker Studio
Overview: Looker Studio (formerly Google Data Studio) is Google's free dashboarding tool, tightly integrated with Google Analytics, Google Ads, and BigQuery. It's the default choice for marketing teams that need shareable reports without a software budget. See Google's official Looker Studio documentation for connector and sharing details.
Best For: Free marketing and web analytics dashboards, especially for teams already in the Google ecosystem.
Key Features: Drag-and-drop report builder, native Google Analytics/Ads/Sheets connectors, shareable links similar to Google Docs.
AI Features: Gemini-assisted formula suggestions and chart recommendations are rolling out across Google Workspace tools, including Looker Studio.
Pros:
- Genuinely free for the core product, with no artificial row or user limits on the free tier
- Best-in-class native integration with Google Analytics and Google Ads
- Sharing works exactly like Google Docs - familiar and frictionless
Cons:
- Performance can lag on very large datasets compared to purpose-built BI engines
- Fewer advanced statistical or modeling features than Power BI or Tableau
- Looker Studio Pro (for enterprise governance features) pricing requires contacting Google Cloud sales
Pricing: Free for core Looker Studio; Looker Studio Pro pricing is quote-based via Google Cloud. Confirm current terms on Google's official documentation, since Google has repositioned this product before (it absorbed the "Data Studio" brand and continues integrating with the enterprise "Looker" platform).
Supported Platforms: Web-based, works in any modern browser.
Integrations: Google Analytics, Google Ads, Google Sheets, BigQuery, and 800+ community connectors.
Who Should Use It: Marketing teams and small businesses that need free, shareable reporting without procurement friction.
Who Should Avoid It: Enterprises needing row-level security, large-scale governance, or heavy statistical modeling.
Editorial note: For a marketing team reporting on campaign performance, Looker Studio genuinely competes with paid tools - the free price point makes it an easy first recommendation before anyone commits budget to Power BI or Tableau.
8. Apache Spark
Overview: Apache Spark is an open-source distributed computing engine built for processing massive datasets across clusters of machines. It's the backbone underneath many "big data" platforms, including Databricks, which was founded by Spark's original creators.
Best For: Big data processing, ETL pipelines, and machine learning at scale that a single machine can't handle.
Key Features: In-memory distributed processing, Spark SQL, MLlib for machine learning, Structured Streaming for real-time data.
AI Features: MLlib supports classification, regression, and clustering at scale; Spark increasingly serves as the processing layer feeding AI/LLM pipelines rather than shipping its own chat-style assistant.
Pros:
- Handles datasets far beyond what Excel, Power BI, or even a single Python process can process
- Open source with no licensing fee for the core engine
- Backed by the Apache Software Foundation with an active global contributor base
Cons:
- Requires real engineering skill to set up, tune, and operate a cluster
- Overkill for datasets that comfortably fit on one machine
- Debugging distributed jobs is genuinely harder than debugging a single-machine script
Pricing: Free and open source; most teams run it via a managed cloud service (Databricks, AWS EMR, Azure Synapse) that charges for compute.
Supported Platforms: Cross-platform; typically deployed on Linux clusters, on-premises or in the cloud.
Integrations: Hadoop, Kafka, Delta Lake, Databricks, AWS, Azure, Google Cloud.
Who Should Use It: Data engineering teams processing terabyte- or petabyte-scale datasets.
Who Should Avoid It: Small teams or anyone whose dataset fits comfortably in Excel or a single Python dataframe - Spark solves a scale problem you may not have yet.
Editorial note: A common mistake with Spark is adopting it before there is a real "too big for one machine" problem. Don't reach for it until your data volume forces your hand.
9. Snowflake
Overview: Snowflake is a cloud-native data warehouse that separates storage and compute, letting organizations scale each independently. It's become one of the default platforms for centralizing company-wide data before analysis in BI tools. Architecture and feature details are covered in Snowflake's official documentation.
Best For: Cloud data warehousing and centralizing data from multiple sources for downstream BI and analytics tools.
Key Features: Separated storage/compute architecture, near-zero-maintenance scaling, native support for structured and semi-structured data, data sharing across organizations without copying data.
AI Features: Cortex AI provides built-in large language model functions directly inside SQL queries, and Snowflake Copilot generates SQL from natural-language prompts.
Pros:
- Scales compute up or down independently of storage, which controls cost far better than fixed-capacity systems
- Strong cross-account data-sharing model, useful for organizations exchanging data with partners
- Broad ecosystem integration with every major BI tool on this list
Cons:
- Consumption-based pricing means costs can spike with inefficient queries if left unmonitored
- Requires data engineering skill to design efficient warehouse architecture
- Not a visualization tool itself - you'll pair it with Power BI, Tableau, or Looker Studio
Pricing: Consumption-based, either on-demand (month to month) or pre-paid capacity with discounts for larger commitments, plus a monthly storage fee, with a free trial for new accounts. Editions are Standard, Enterprise, Business Critical and Virtual Private Snowflake. See Snowflake's pricing page and its pricing calculator, since credit prices vary by cloud, region and edition.
Supported Platforms: Cloud-only - runs on AWS, Azure, and Google Cloud.
Integrations: Power BI, Tableau, Looker, dbt, Fivetran, Python, and virtually every modern data stack tool.
Who Should Use It: Mid-market to enterprise organizations centralizing data from multiple systems before it reaches BI tools.
Who Should Avoid It: Small businesses with one or two simple data sources - a warehouse layer adds cost and complexity you don't need yet.
Editorial note: Snowflake earns its reputation as "the warehouse that doesn't require a DBA babysitting it," but the consumption pricing model means the real risk isn't the sticker price - it's an unmonitored query that runs a $40 job every night without anyone noticing for six months.
10. Databricks
Overview: Databricks combines a Spark-based processing engine with a unified workspace for data engineering, data science, and machine learning - often described as a "lakehouse" architecture that blends data lake flexibility with data warehouse structure. See Databricks' official documentation for architecture details and setup guides.
Best For: Organizations that need one platform spanning data engineering, machine learning, and analytics rather than separate tools for each.
Key Features: Collaborative notebooks, Delta Lake for reliable data storage, MLflow for machine learning lifecycle management, Unity Catalog for governance.
AI Features: Databricks Assistant helps write and debug code inside notebooks; AutoML automates model selection and tuning for common machine learning tasks.
Pros:
- Genuinely unifies data engineering and data science workflows other platforms keep separate
- Strong governance tooling (Unity Catalog) for enterprises with compliance requirements- Deep, well-documented integration with Apache Spark and open-source ML frameworks
Cons:
- Steep learning curve - this is an engineering platform first, an analyst tool second
- Consumption-based pricing requires active cost monitoring, similar to Snowflake
- Overkill for teams that just need dashboards rather than machine learning pipelines
Pricing: Pay-as-you-go, billed per second in Databricks Units (DBUs), with committed-use contracts available for discounts. According to Databricks' pricing page, a free trial exists and a limited Free Edition has replaced the old Community Edition for learning Spark. Rates vary by cloud provider, region and workload, so check the page directly.
Supported Platforms: Cloud-only - AWS, Azure, and Google Cloud.
Integrations: Power BI, Tableau, Python, R, Snowflake (via partner connectors), Kafka, and most major cloud data services.
Who Should Use It: Data science and machine learning teams that need to move from raw data to a trained model to production, all in one place.
Who Should Avoid It: Teams whose primary need is business dashboards rather than machine learning - Power BI or Tableau will be faster to deploy and cheaper to run.
Editorial note: Databricks is at its best when a company has actual machine learning workloads, not just reporting needs. A team whose real need is a dashboard can end up paying for a platform built for model training.
11. IBM SPSS Statistics
Overview: SPSS has been a staple of academic and market-research statistics since long before "data science" was a job title, and it remains the tool of choice in psychology, social science, and survey research departments worldwide. Full procedure references are in IBM's official SPSS Statistics documentation.
Best For: Academic research, survey analysis, and statistical testing for users who want menu-driven statistics without writing code.
Key Features: Point-and-click statistical procedures (regression, ANOVA, factor analysis), syntax editor for reproducible scripts, integration with R and Python for extensibility.
AI Features: Recent versions include AI-assisted interpretation of statistical output, aimed at helping non-specialists understand what a test result actually means.
Pros:
- Menu-driven interface makes serious statistics accessible without programming
- Deep bench of validated statistical tests trusted in peer-reviewed research
- Strong student and academic discount programs
Cons:
- Genuinely expensive for individuals and small organizations relative to free alternatives like R
- Visualization output is functional but dated compared to Tableau or Power BI
- Add-on modules (advanced statistics, forecasting) cost extra on top of the base subscription
Pricing: IBM's SPSS Statistics pricing page lists a Base subscription starting at $99 per authorized user and add-on subscriptions starting at $79 per authorized user (the page did not make the billing period clear to me). Student and academic discounts may apply. Verify the current terms and billing period on IBM's page.
Supported Platforms: Windows, Mac.
Integrations: Excel, R, Python, Power BI, Tableau, Cognos Analytics.
Who Should Use It: Researchers, social scientists, and market research teams who need validated statistical tests without a programming background.
Who Should Avoid It: Budget-conscious teams or individuals - R delivers comparable (often superior) statistical depth for free.
Editorial note: SPSS survives because trust in academic and clinical settings is hard-won and slow to change - reviewers and journal editors know it, students are trained on it, and that institutional inertia is worth more to universities than the license fee.
12. Alteryx
Overview: Alteryx built its reputation on data blending and preparation - taking messy data from multiple systems and turning it into something analysis-ready - through a visual, drag-and-drop workflow builder rather than code. See Alteryx's official product documentation for the full tool and workflow library.
Best For: Automating repetitive data preparation and blending workflows without writing scripts.
Key Features: Visual workflow canvas, hundreds of pre-built data transformation tools, spatial analytics, predictive modeling tools built on open-source R and Python underneath the hood.
AI Features: AiDIN, Alteryx's AI layer, assists with workflow building, natural-language data questions, and automated insight generation.
Pros:
- Dramatically reduces the manual work of blending data from spreadsheets, databases, and APIs
- Visual workflow builder is genuinely more approachable than writing ETL code
- Strong fit for analysts who understand data logic but don't want to code
Cons:
- Enterprise pricing is not published and typically requires a sales conversation
- Workflows can become difficult to audit and maintain as they grow more complex
- Licensing has historically been a common budget pain point compared to open-source alternatives (Python, KNIME)
Pricing: Custom, quote-based enterprise pricing; free trial available. Alteryx does not publish standard list pricing - request a quote directly and compare it against open-source alternatives like KNIME or Python before committing.
Supported Platforms: Windows desktop, Alteryx Cloud.
Integrations: Excel, SQL databases, Tableau, Power BI, Snowflake, Salesforce.
Who Should Use It: Analysts doing heavy, repeated data blending work (combining CRM, ERP, and spreadsheet data, for example) who want to avoid manual VLOOKUPs every week.
Who Should Avoid It: Teams with programming capability already on staff - Python with pandas can replicate most Alteryx workflows at zero licensing cost.
Editorial note: Alteryx earns its keep in organizations with genuinely messy, multi-source data and analysts who aren't coders. If you already have a Python-literate team, you're often paying enterprise software prices for something your team could script for free.
13. Qlik Sense
Overview: Qlik Sense's differentiator is its associative engine - instead of forcing users down a predefined drill path, it lets you click any data point and see everything related to it, in any direction, instantly. Technical documentation is available through Qlik's official help site.
Best For: Organizations that need flexible, non-linear data exploration rather than fixed dashboard paths.
Key Features: Associative data model, in-memory processing, Qlik Answers for generative-AI search over data, Qlik Predict for forecasting.
AI Features: Qlik Answers (GenAI search), Qlik Predict (explainable predictive AI), and augmented analytics suggestions built into the exploration interface.
Pros:
- The associative model genuinely changes how exploratory analysis feels compared to path-based BI tools
- Strong governance and scalability for large enterprise deployments
- Growing AI feature set aimed specifically at explainability, not just automation
Cons:
- Meaningfully more expensive than Power BI at every comparable tier
- No permanent free plan for business use (only a free trial)
- Learning the associative model takes real onboarding time for teams used to traditional BI
Pricing: According to Qlik's pricing page, Qlik Cloud Analytics is priced by data capacity, not per user: Starter is $300 a month (10 users, 10 GB), Standard is $825 a month (25 GB, no extra charge for additional users), Premium is $2,750 a month (50 GB), and Enterprise is custom. Compare the total against per-user tools at your headcount.
Supported Platforms: Web, cloud, on-premises (Qlik Sense Enterprise on Windows Server).
Integrations: Snowflake, Databricks, SAP, Salesforce, and a broad connector library similar in scope to Power BI and Tableau.
Who Should Use It: Mid-market and enterprise organizations with complex, interrelated datasets where users need to explore relationships freely, not just view fixed reports.
Who Should Avoid It: Small businesses or teams price-sensitive enough that Power BI's cost advantage matters more than the associative engine's exploratory benefits.
Editorial note: Qlik's associative engine is a genuine technical differentiator, not marketing fluff - but you're paying an enterprise premium for it, and most organizations under 50 users won't feel the difference enough to justify the cost gap over Power BI.
14. KNIME
Overview: KNIME (Konstanz Information Miner) is an open-source, visual workflow platform for data analytics, reporting, and machine learning - essentially a free alternative to Alteryx's drag-and-drop approach. The full node and workflow library is documented at KNIME's official documentation site.
Best For: No-code/low-code data science and workflow automation on a zero-dollar software budget.
Key Features: Visual workflow canvas with hundreds of nodes, native integration with Python and R scripting nodes, machine learning and deep learning extensions.
AI Features: The K-AI assistant helps build workflows from natural-language descriptions, and dedicated AI extensions support LLM integration and generative AI workflows.
Pros:
- The core desktop platform is genuinely free, with no artificial dataset size caps for individual use
- Visual builder lowers the barrier to entry for data science work compared to pure code
- Strong extensibility via native Python and R nodes for advanced users
Cons:
- Interface feels less polished than commercial competitors like Alteryx
- Larger workflows can become memory-intensive on local machines
- Enterprise features (collaboration, deployment, scheduling) require paid KNIME Business Hub add-ons
Pricing: KNIME Analytics Platform is free and open source; KNIME Business Hub (for collaboration, deployment, and scheduling at scale) is paid and quote-based.
Supported Platforms: Windows, Mac, Linux.
Integrations: Python, R, SQL databases, Apache Spark, Tableau, Power BI.
Who Should Use It: Budget-conscious teams that want Alteryx-style visual workflows without the enterprise licensing cost.
Who Should Avoid It: Large enterprises needing polished, fully managed deployment and governance out of the box - KNIME's free tier requires more DIY setup than Alteryx's paid platform.
Editorial note: KNIME is one of the most underrated tools in this entire list. It genuinely replicates most of what teams pay Alteryx for, at zero licensing cost - the tradeoff is a rougher interface and more self-service setup.
15. RapidMiner (Altair AI Studio)
Overview: RapidMiner, now marketed as Altair AI Studio following Altair's acquisition of the company, is a visual, no-code platform focused specifically on predictive modeling and machine learning rather than general BI reporting. See Altair's official AI Studio documentation for current product details.
Best For: Predictive modeling and machine learning for teams that want automation over hand-coding.
Key Features: Visual process designer, Auto Model for automated machine learning, a large library of pre-built modeling operators, model deployment tools.
AI Features: Built-in AutoML automatically tests and ranks multiple modeling approaches; an AI assistant helps guide model-building decisions for less experienced users.
Pros:
- Auto Model genuinely lowers the barrier to building a working predictive model without deep ML expertise
- Visual process builder is intuitive for analysts who understand the modeling logic but not the code
- Strong track record in academic and applied machine learning education
Cons:
- Free tier is limited by dataset row count, pushing serious use toward paid tiers
- Enterprise pricing is not published and requires a sales conversation
- Smaller community and talent pool than Python's scikit-learn ecosystem
Pricing: Free tier available with row limits; paid Altair AI Studio tiers are custom-quoted. Confirm current tiers directly with Altair, since pricing and packaging changed materially after the RapidMiner acquisition.
Supported Platforms: Windows, Mac, Linux.
Integrations: Python, R, SQL databases, Hadoop, Excel.
Who Should Use It: Analysts who want to build and deploy predictive models without becoming full-time data scientists.
Who Should Avoid It: Teams already comfortable in Python - scikit-learn and PyCaret replicate most of RapidMiner's capability for free.
Editorial note: RapidMiner's Auto Model feature has genuinely helped non-specialist analysts ship their first working predictive model faster than starting from a blank Jupyter notebook. It's a legitimate on-ramp into machine learning, not just a marketing feature.
16. Grafana
Overview: Grafana is the standard open-source tool for real-time monitoring dashboards, especially in DevOps, infrastructure monitoring, and IoT contexts where data changes by the second rather than the day. Full setup and plugin details are in Grafana Labs' official documentation.
Best For: Real-time analytics and operational monitoring dashboards (server metrics, application performance, IoT sensor data).
Key Features: Time-series visualization, alerting engine, native support for Prometheus, InfluxDB, and dozens of other time-series and log data sources.
AI Features: Grafana ML provides anomaly detection and forecasting on time-series data; recent versions include AI-assisted dashboard and query generation.
Pros:
- The open-source core is genuinely free with no artificial limitations for self-hosted use
- Best-in-class for real-time, time-series data specifically - a category most BI tools handle poorly
- Massive plugin ecosystem for infrastructure and monitoring data sources
Cons:
- Not designed for general business intelligence or ad hoc business-user analysis
- Self-hosting requires ongoing infrastructure maintenance
- Learning curve for non-technical users is steeper than consumer-facing BI tools
Pricing: Free and open source (self-hosted). On Grafana Cloud, the Free plan is $0 with usage limits and 14-day retention, the Pro plan starts at $19 a month plus usage-based charges, and Enterprise has a minimum annual commitment of $25,000. Check the page for current terms.
Supported Platforms: Web-based; self-hosted on Linux/Docker/Kubernetes or via Grafana Cloud.
Integrations: Prometheus, InfluxDB, Elasticsearch, PostgreSQL, MySQL, AWS CloudWatch, Azure Monitor.
Who Should Use It: DevOps, SRE, and infrastructure teams monitoring systems, applications, or IoT devices in real time.
Who Should Avoid It: Business teams needing standard financial or marketing reporting - Grafana is purpose-built for operational and time-series data, not business KPIs.
Editorial note: Grafana solves a category of problem that Power BI and Tableau genuinely aren't built for: dashboards that need to update every few seconds and alert someone at 3 a.m. If your "data analysis" need is actually "system monitoring," this is the right category, not BI software.
17. SAS
Overview: SAS is the longest-standing enterprise statistical software platform on this list, still deeply embedded in banking, insurance, pharmaceuticals, and government agencies that require validated, auditable statistical modeling. Product documentation is available through SAS's official support site.
Best For: Regulated industries (finance, insurance, pharma, government) needing validated statistical modeling and audit trails.
Key Features: SAS programming language, SAS Viya for cloud-based analytics and AI, extensive statistical procedure library, strong data governance and audit capabilities.
AI Features: SAS Viya includes AI and machine learning capabilities alongside traditional statistics, plus a Copilot-style assistant for generating and explaining SAS code.
Pros:
- Decades of validation in regulated industries, which matters enormously for compliance-heavy sectors
- Strong governance, audit trail, and documentation features built for regulatory scrutiny
- SAS Viya modernizes the platform with cloud deployment and AI/ML capability
Cons:
- Among the most expensive tools on this list, with pricing requiring a direct sales conversation
- Steeper learning curve than R or Python for newcomers, with a smaller open talent pool than either
- Younger analysts increasingly train on Python and R instead, shrinking the available hiring pool over time
Pricing: Custom, enterprise quote-based; a free SAS OnDemand for Academics option exists for students and educators. SAS does not publish standard commercial pricing - request a quote directly and factor in multi-year licensing terms.
Supported Platforms: Windows, cloud (SAS Viya), Linux (server deployments).
Integrations: Excel, SQL databases, Snowflake, Hadoop, and most major enterprise data platforms.
Who Should Use It: Regulated industries where audit trails, validated methodology, and compliance documentation outweigh cost concerns.
Who Should Avoid It: Startups and small businesses - the cost and learning curve rarely make sense outside regulated, enterprise-scale use cases.
Editorial note: SAS persists in banking and pharma for the same reason SPSS persists in academia: institutional trust and regulatory precedent are worth more than the license fee, and switching costs (revalidating models, retraining staff) are enormous. Many organizations also train newer analysts in Python alongside SAS, since Python skills are widely available.
Tool Comparison Table: Coding Required vs No-Code (Rough Editorial Estimates)
| Tool | Coding Required? | Typical Learning Time | Free Option |
|---|---|---|---|
| Excel | No | Days | Yes |
| Power BI | Minimal (DAX for advanced use) | 1–3 weeks | Yes (limited) |
| Tableau | Minimal (calculated fields) | 2–4 weeks | Yes (public only) |
| Looker Studio | No | Days | Yes |
| Grafana | Minimal (query languages) | 1–2 weeks | Yes |
| Qlik Sense | Minimal | 2–4 weeks | Trial only |
| KNIME | No (visual workflows) | 1–2 weeks | Yes |
| RapidMiner | No (visual workflows) | 1–2 weeks | Limited |
| Alteryx | No (visual workflows) | 2–3 weeks | Trial only |
| SQL | Yes | 2–4 weeks for basics | Yes |
| Python | Yes | Months for proficiency | Yes |
| R | Yes | Months for proficiency | Yes |
| Apache Spark | Yes | Months (requires SQL/Python/Scala) | Yes |
| Snowflake | Yes (SQL) | Weeks, if SQL already known | Trial credits |
| Databricks | Yes (SQL/Python/Scala) | Months | Free Edition |
| SPSS | No (menu-driven) | 1–3 weeks | Trial only |
| SAS | Yes (SAS language) | Months | Academic only |
Which Tool Should You Choose? A Decision Framework
Instead of a generic "it depends," use this simple decision guide.
Start here: What's your primary bottleneck?
- "We can't get answers fast enough." → You need a BI/dashboard tool. If you're on Microsoft 365, start with Power BI. If visual polish and exploratory flexibility matter more than cost, use Tableau.
- "Our data lives in ten different systems and it's a mess before we even start analyzing." → You need a data prep/blending layer. Alteryx if budget allows and your team isn't coding, KNIME if it is and budget is tight, Python/pandas if your team already codes.
- "We need to predict something, not just report on the past." → You need statistical or ML tooling. Python for flexibility and job-market alignment, R for pure statistical rigor, RapidMiner/Altair AI Studio if your team wants AutoML without code.
- "Our data has outgrown a single spreadsheet or database." → You need a cloud warehouse or big-data engine. Snowflake for a clean, SQL-first warehouse; Databricks if you also need machine learning in the same platform; Apache Spark if you're building custom infrastructure rather than buying a managed platform.
- "We need dashboards that update by the second, not by the day." → Grafana, not a traditional BI tool.
- "We're in a regulated industry and need audit-proof statistics." → SAS or SPSS, depending on whether you need enterprise scale (SAS) or individual/team-level statistical testing (SPSS).
- "We just need to answer a question this afternoon." → Excel or SQL, almost always. Don't reach for a platform when a spreadsheet or a single query will do.
Quick Recommendations by Team Size
| Team Size | Recommended Stack |
|---|---|
| Solo analyst / freelancer | Excel + SQL + Python |
| Startup (under 20 people) | Power BI or Looker Studio + SQL |
| Growing SMB (20–200 people) | Power BI or Tableau + SQL + Snowflake |
| Enterprise (200+ people) | Tableau or Power BI/Fabric + Snowflake or Databricks + Python/R |
| Data science team | Python + R + Databricks or Spark |
| Regulated industry (finance, pharma) | SAS or SPSS + Python for newer hires |
Common Mistakes When Choosing a Data Analysis Tool
Buying the enterprise tool before you have an enterprise problem. Qlik Sense, Alteryx, and SAS are excellent tools solving specific, large-scale problems. A ten-person company buying them because "that's what serious companies use" often ends up with a five-figure line item and a tool three people know how to open.
Ignoring the skills your team actually has. The best tool on paper is worthless if nobody on your team can use it in six months. A Python-fluent team gains little from Alteryx's visual workflows; a team with zero coding background will struggle with Databricks regardless of its capability.
Underestimating the licensing model, not just the sticker price. Power BI's per-user pricing, Tableau's Creator/Explorer/Viewer tiers, and Snowflake's consumption credits can all produce a bill that looks nothing like the number on the pricing page once real usage kicks in. Model your actual usage before committing.
Choosing visualization over data quality. A gorgeous Tableau dashboard built on messy, unreconciled data is worse than a plain Excel table built on clean data - it just makes the wrong numbers look more convincing. Fix the data pipeline before investing in the front end.
Assuming AI features replace the need for data literacy. Copilot-style assistants in Power BI, Tableau, and Snowflake are genuinely useful, but they generate plausible-looking answers whether or not the underlying question or data model makes sense. Someone on the team still needs to know enough to sanity-check the output.
Skipping the pilot. Every tool on this list looks reasonable in a sales demo. Run a real pilot with your actual (messy) data and your actual (busy, skeptical) staff before signing an annual contract.
Industry Recommendations
Tool needs vary by industry, largely driven by regulatory requirements and data volume. These suggestions are editorial judgments, not research findings, and your own compliance and security requirements should decide.
Healthcare: SPSS or SAS for clinical and regulatory statistical work where validated methodology matters; Power BI or Tableau for operational dashboards (bed occupancy, patient flow) that don't require clinical validation.
Finance: SAS for regulated risk modeling and compliance reporting; Python for quantitative analysis and algorithmic work; Power BI or Tableau for executive and client-facing dashboards; Snowflake as the underlying data warehouse.
Retail: Power BI or Looker Studio for sales and marketing dashboards; Snowflake or Databricks for centralizing point-of-sale, e-commerce, and inventory data; Python for demand forecasting.
Manufacturing: Grafana for real-time production-line and IoT sensor monitoring; Power BI or Qlik Sense for supply chain and quality dashboards; Alteryx or KNIME for blending ERP and MES data.
Marketing: Looker Studio for free, fast campaign reporting; Power BI or Tableau once budget allows for cross-channel analysis; SQL for anyone querying a customer data platform directly.
Education: SPSS remains the default for research and thesis work; R for statistics-heavy academic departments; Excel and Power BI for institutional administrative reporting.
Startups: Excel and Looker Studio early, migrating to Power BI and a lightweight Snowflake instance once data volume and team size justify it. Avoid enterprise contracts (Qlik, Alteryx, SAS) until you have a specific, demonstrated need.
SMBs: Power BI for BI/reporting, SQL for querying, and Python for anything that starts feeling repetitive enough to automate.
Enterprise: A layered stack is normal and expected - Snowflake or Databricks as the data foundation, Tableau or Power BI/Fabric for BI, Python and R for data science, and SAS or SPSS if regulated statistical work is part of the mandate.
Future Trends in Data Analysis Tools
Agentic analytics is replacing simple chatbots. Tableau Next, Qlik Answers, and Databricks Assistant are moving beyond "ask a question, get a chart" toward AI agents that can independently investigate a metric change, form a hypothesis, and check it against the data - with a human reviewing the conclusion rather than building the query.
Natural-language querying is becoming the default entry point. Copilot in Power BI, Snowflake Cortex, and Tableau Agent all now let non-technical users ask questions in plain English and get a working query or visualization back. This doesn't eliminate the need for data literacy, but it lowers the barrier for first drafts.
AutoML is narrowing the gap between analysts and data scientists. Tools like RapidMiner's Auto Model and Databricks AutoML let analysts without deep statistics backgrounds build reasonably good predictive models, though understanding what the model is actually doing still matters for anything high-stakes.
Embedded analytics is spreading beyond BI teams. More software products are shipping analytics directly inside the application itself (via Power BI Embedded, Tableau Embedded Analytics, or custom-built dashboards) rather than sending users to a separate BI portal.
Predictive and real-time analytics are converging. Grafana's move into ML-based anomaly detection and Qlik Predict's explainable forecasting both point toward a future where "monitoring" and "predicting" are the same dashboard, not two separate categories of tool.
Consumption-based pricing is spreading from data warehouses to BI tools. Snowflake and Databricks popularized pay-for-what-you-use pricing; expect more BI platforms to blend per-user licensing with usage-based components as AI features (which cost real compute per query) become standard rather than optional.
Key Takeaways
- Power BI is a strong value for Microsoft-centered teams, with deep Microsoft 365 integration and the lowest list per-user price among the BI tools here that publish one.
- Tableau still wins on visualization depth and is the stronger choice for teams that live and breathe custom dashboards.
- Python and R remain the standard for statistical modeling, machine learning, and reproducible analysis - and both are completely free.
- SQL isn't optional anymore. It's the shared language every tool on this list eventually asks you to know.
- AI features (natural-language queries, auto-generated insights, agentic analysis) are now table stakes, not differentiators - nearly every vendor on this list has shipped a Copilot-style assistant since 2024.
- Free and open-source tools (Python, R, SQL, KNIME, Grafana, Looker Studio) cover a large share of analytical needs. Paid tools tend to earn their price on governance, support and scale more than on raw capability.
Conclusion
There's no universal "best" data analysis tool, and any article that tells you otherwise is selling you something. What actually matters is honestly assessing three things: how technical your team is today, how big your data will realistically get in the next two years, and what you're actually trying to answer.
Start smaller than you think you need to. Excel, SQL, and a free trial of Power BI or Looker Studio will tell you more about your real requirements in a month than any vendor's sales deck will. Add complexity - Snowflake, Databricks, Alteryx, SAS - only when a specific, demonstrated bottleneck justifies it, not because a competitor uses it or an analyst wants a resume line.
The tools on this list will keep adding AI features every quarter. The fundamentals won't change nearly as fast: clean data beats a pretty dashboard, a tool your team will actually use beats the one with the longest feature list, and SQL is worth learning no matter which platform you end up choosing on top of it.
Frequently Asked Questions
What is the best data analysis tool for beginners? Excel is the best starting point for most beginners because it's already familiar and handles small-to-medium datasets well. For anyone planning a long-term analytics career, learning basic SQL alongside Excel builds a foundation that transfers directly to every other tool on this list.
What is the best free data analysis software? Python, R, and SQL are completely free and cover the vast majority of analytical needs, from statistics to machine learning to querying. For dashboarding specifically, Looker Studio and Grafana are strong free options, and KNIME is a genuinely capable free alternative to paid workflow tools like Alteryx.
Power BI vs Tableau: which is better? Power BI generally wins on price and Microsoft 365 integration, making it the better fit for organizations already in that ecosystem with cost-sensitive licensing needs. Tableau generally wins on visualization flexibility and depth of interactivity, making it the better fit for teams whose primary deliverable is polished, exploratory dashboards. Neither is universally "better" - it depends on your existing tech stack and how much your team values visual customization versus lower total cost.
Excel vs Power BI: when should I upgrade? Upgrade from Excel to Power BI when you need to share live dashboards with more than a handful of people, when multiple people need to view the same data simultaneously without version-control chaos, or when your dataset grows large enough that Excel becomes slow or unstable.
What tools do professional data analysts actually use? Most professional data analysts use a combination rather than a single tool: SQL for querying, Excel or a BI tool (Power BI/Tableau) for reporting, and Python or R for deeper statistical analysis or automation. Which combination depends heavily on industry - finance and pharma analysts lean more on SAS or SPSS, while tech and startups lean more on Python and cloud warehouses.
Is Python better than R for data analysis? Neither is strictly "better" - Python has the broader ecosystem for general-purpose data science, automation, and machine learning, plus a larger job market. R has deeper, more specialized statistical packages and is often preferred in academic research and biostatistics where methodological rigor is paramount.
What is the best AI-powered data analysis tool? Most major platforms - Power BI (Copilot), Tableau (Tableau Agent), Snowflake (Cortex), and Qlik Sense (Qlik Answers) - now include AI features for natural-language querying and automated insight generation. The "best" one depends on which platform you're already using, since these AI features are add-ons to existing tools rather than standalone products.
What is the best data analysis software for small business? Power BI and Looker Studio are the strongest starting points for small businesses - both offer low or no cost entry points, don't require a dedicated data engineering team, and integrate with common small-business tools like Excel, Google Analytics, and QuickBooks-adjacent data sources.
Are open-source data analysis tools reliable for enterprise use? Yes, with the right operational support. Python, R, Apache Spark, and Grafana all power production systems at large enterprises today - the tradeoff isn't reliability, it's that open-source tools require your own team (or a paid support contract) to handle deployment, security, and maintenance that commercial vendors otherwise bundle in.
What's the difference between a BI tool and a data warehouse? A data warehouse (Snowflake, Databricks) stores and processes large volumes of data centrally. A BI tool (Power BI, Tableau) connects to that data and turns it into dashboards, reports, and visualizations. Most serious analytics stacks use both - a warehouse for storage and processing, a BI tool for the front-end reporting layer.
How much does a data analysis tool cost for a small team? For a small team, free tools (SQL, Python, Looker Studio) can cost nothing, and Power BI Pro is listed at $14 per user per month if you need shared dashboards. Costs scale up significantly with tools like Tableau, Qlik Sense, or a consumption-based warehouse like Snowflake once data volume and team size grow.
Do I need to know how to code to analyze data in 2026? Not necessarily to get started - tools like Excel, Power BI, Tableau, Looker Studio, KNIME, and Alteryx are built for non-coders. But basic SQL knowledge has become close to a baseline expectation for anyone doing analysis professionally, and Python or R knowledge significantly expands what you can do independently as your needs grow more advanced.
What is the best tool for real-time data analysis? Grafana is purpose-built for real-time, time-series data such as server metrics, application performance, and IoT sensor readings, and it's the standard choice in DevOps and infrastructure monitoring contexts. Traditional BI tools like Power BI and Tableau can handle near-real-time refreshes but aren't optimized for second-by-second monitoring the way Grafana is.
Is Snowflake or Databricks better for my company? Choose Snowflake if your primary need is a clean, SQL-first data warehouse that BI tools can connect to. Choose Databricks if you also need machine learning and data engineering capability in the same platform, since it's built around Apache Spark and a broader "lakehouse" architecture rather than warehouse-only functionality.
What data analysis skills are most in demand in 2026? SQL, Python and a specific BI tool (usually Power BI or Tableau, depending on the employer's existing stack) are among the skills most often asked for in data roles. Check current job listings in your market for the mix that matters to you. The Stack Overflow Developer Survey publishes annual data on which languages and tools developers use.