
Best Business Intelligence Tools in 2026: 7 Platforms Compared
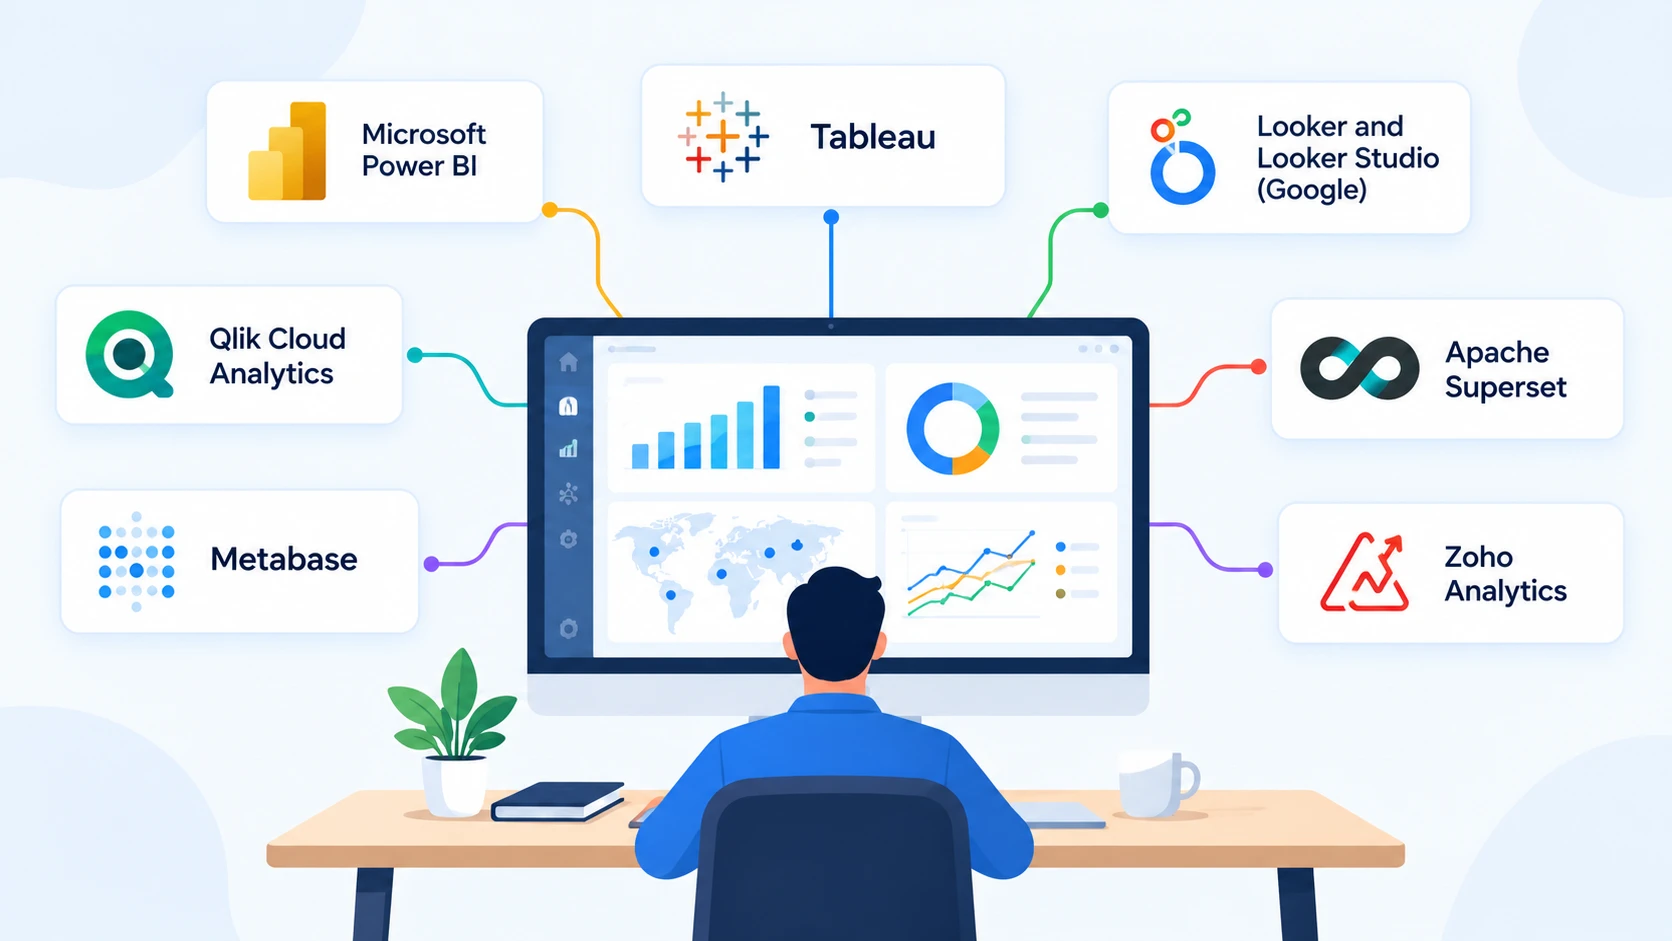
Quick Answer: What Are the Best Business Intelligence Tools?
There is no single best business intelligence tool, because the right one depends on your data, your users and your budget. Based on each vendor's own documentation and pricing pages, this is how the main options line up:
- Microsoft Power BI: Microsoft's BI platform, part of Microsoft Fabric, with a free desktop app and per-user paid plans.
- Tableau: a visual analytics platform reported to be sold by role (Creator, Explorer, Viewer).
- Looker and Looker Studio: Google's BI products; Looker Studio is free for building and viewing reports, while the Looker platform is an enterprise product sold by quote.
- Qlik Cloud Analytics: capacity-based plans that start at $300 a month.
- Metabase: an open-source tool with a free self-hosted edition and paid cloud plans.
- Apache Superset: a fully open-source data exploration and visualization platform.
- Zoho Analytics: a BI product with a free plan limited to 2 users and 10,000 rows.
This guide explains what BI tools do, compares these seven on the points that matter, covers free and open-source options and AI features, and gives a checklist for choosing. It relies on vendor pages and documentation, and it labels any price that could not be read directly from the vendor. It does not rank tools by hands-on testing.
Introduction
Business intelligence tools turn data from many systems into reports and dashboards that people can use to make decisions. The category is crowded: some products are built for enterprises with dedicated data teams, some for small teams that want a dashboard this week, and some are open source and free to run yourself.
Choosing between them is mostly a matter of fit. A tool that suits a large Microsoft-based company can be the wrong choice for a five-person startup, and the reverse is also true. This guide focuses on the questions that decide fit: who builds the reports, who only views them, where the data lives, how the tool is priced and what it will cost as usage grows.
If you want the fundamentals first, start with our guide to what business intelligence is. For a broader roundup that includes general data analysis software, see our list of the best data analysis tools.
What Do Business Intelligence Tools Do?
A business intelligence tool connects to your data, helps you model and explore it, and presents the results as reports and dashboards. Microsoft's description of Power BI illustrates the typical workflow: connect to data sources, prepare and model the data, build reports and dashboards, explore and analyze, share and collaborate, and administer and secure the result (Microsoft Learn).
Most business intelligence software covers four jobs:
- Connect: pull data from databases, files, cloud apps and warehouses.
- Model: define relationships and metrics so numbers are consistent.
- Visualize: build charts, dashboards and reports.
- Share and govern: distribute results and control who can see what.
Tools differ in how much each job is handled visually, how much needs SQL or code, and how they charge for it.
Business Intelligence Tools Compared at a Glance
| Tool | Suited to (editorial) | Free option | Pricing model | Source of pricing |
|---|---|---|---|---|
| Power BI | Microsoft-centered organizations | Desktop is free; sharing needs Pro or Premium | Per user | Microsoft pricing page |
| Tableau | Teams that want role-based seats | Not confirmed | Per user, by role | Third-party reports; vendor page not readable |
| Looker Studio / Looker | Google Cloud users | Looker Studio is free | Per user (Studio Pro) / quote-based (Looker) | Third-party reports |
| Qlik Cloud Analytics | Capacity-based pricing | Free trial | Capacity-based tiers | Qlik pricing page |
| Metabase | Teams that want a free self-hosted option or embedding | Open-source edition is free | Per plan plus extra users | Metabase pricing page |
| Apache Superset | Teams that want fully open source | Free (you host it) | None for the software | Apache Superset site |
| Zoho Analytics | Teams that want a free starter plan, Zoho app users | Free plan (2 users, 10K rows) | Per plan, by users and rows | Zoho pricing page |
Prices change often and often vary by region, billing term and edition, so confirm on each vendor's site before buying.
1. Microsoft Power BI
What it is: Microsoft's business analytics platform, described on Microsoft Learn as helping you "turn data into actionable insights." It has two main parts: Power BI Desktop, a Windows app for building reports, and the Power BI service, a cloud platform for publishing, sharing and collaborating, plus a mobile app. Desktop can connect to more than 100 data sources, and Microsoft calls Power BI a core component of Microsoft Fabric (Microsoft Learn).
Pricing (Microsoft's pricing page): Power BI Desktop is a free download. Power BI Pro is $14 per user per month paid yearly and is included in Microsoft 365 E5. Premium Per User is $24 per user per month paid yearly, adding larger datasets, more frequent refreshes (48 a day versus 8) and larger model sizes (100 GB versus 1 GB). Power BI Embedded has variable pricing. Free accounts can create reports but must upgrade to Pro or Premium to share them, and are limited to 1 GB model memory and 8 daily refreshes (Microsoft pricing).
Strengths: a free authoring tool, a $14 entry price for sharing, and direct links to the Microsoft ecosystem and Fabric.
Watch out for: sharing requires paid licenses, and licensing can become complicated as an organization grows. Desktop is a Windows app. For a deeper look, see our Power BI business intelligence guide.
2. Tableau
What it is: a visual analytics platform that IBM cites among typical BI visualization tools (IBM). Tableau's own guidance on dashboard design emphasizes understanding your purpose and audience and placing the most important view where viewers look first (Tableau).
Pricing: Tableau's pricing page could not be read when this article was checked. Third-party pricing trackers report that Tableau Cloud Standard is sold by role at about $75 per user per month for Creator, $42 for Explorer and $15 for Viewer, billed annually, with higher Enterprise-edition prices. Treat these as reported figures and confirm with Tableau.
Strengths: a role-based model, as reported, that lets you buy cheaper seats for people who only view dashboards.
Watch out for: costs add up with many Creator seats, and the role structure needs planning.
3. Looker and Looker Studio
What they are: two separate Google products with similar names. Looker Studio is the free tool for building and viewing reports. Looker is Google Cloud's enterprise BI platform.
Pricing: Third-party trackers report that Looker Studio is free to build and view reports, and that Looker Studio Pro starts at about $9 per user per month, billed per user per Google Cloud project, so a team working across several projects can pay for more seats than it has people. They report that the Looker platform is sold by quote, with separate editions and user licensing. Google's own pricing page could not be fully read, so confirm current terms with Google.
Strengths: a free tool for building reports, and a separate enterprise platform for larger deployments on Google Cloud.
Watch out for: the free tool and the enterprise platform differ a lot in scope, and third-party connectors may add cost.
4. Qlik Cloud Analytics
What it is: Qlik's cloud analytics platform, which Qlik describes as "agentic analytics" with interactive analytics, predictive analytics, alerting and no-code data prep (Qlik). It is sold with capacity-based plans.
Pricing (Qlik's pricing page): Starter is $300 a month for 10 users and 10 GB of data. Standard is $825 a month for 25 GB and unlimited users. Premium is $2,750 a month for 50 GB and adds predictive analytics through automated machine learning, anonymous access and SAP data extraction. Enterprise is a custom quote for 250 GB or more. Qlik describes the model as capacity-based pricing for "predictable costs for the year," with overage alerts, and offers a free trial (Qlik pricing).
Strengths: predictable, capacity-based costs and unlimited users on the Standard tier, which can suit organizations with many viewers.
Watch out for: data volume, not user count, drives cost, so estimate your data size before choosing a tier.
5. Metabase
What it is: a BI tool that describes itself as "open source AI analytics you can verify," with questions, interactive dashboards and embedded analytics, available as an open-source edition and as paid cloud or self-hosted plans (Metabase).
Pricing (Metabase's pricing page): the Open Source edition is free with unlimited users. Starter is $100 a month ($90 with yearly billing) including 5 users. Pro is $575 a month ($517.50 annually) including 10 users. Enterprise is custom, starting at $20,000 a year. Extra users cost $6 a month on Starter and $12 on Pro, and users of embeds count as users. The open-source edition includes AI question-asking, SQL generation, more than 20 data sources and unlimited questions and dashboards. Pro adds row and column permissions, SSO, caching controls, usage analytics and multi-tenant embedding (Metabase pricing).
Strengths: a free self-hosted option, simple per-plan pricing and embedding features.
Watch out for: self-hosting means you manage servers, upgrades and security, and advanced governance features sit on paid tiers.
6. Apache Superset
What it is: an open-source data exploration and visualization platform governed by the Apache Software Foundation under the Apache License. Its site describes a no-code builder where you can "drag and drop to create robust charts and tables," 40+ pre-installed visualizations, a SQL editor for custom queries and interactive dashboards. It can connect to "any SQL-based databases," with more than 60 supported databases listed, from PostgreSQL and MySQL to Snowflake, BigQuery and Databricks. The project says it is lightweight and scalable and uses your existing data infrastructure without another ingestion layer (Apache Superset).
Pricing: the software is free. Your costs are hosting, setup and maintenance.
Strengths: no license fees and wide database support.
Watch out for: it generally needs technical staff to deploy and run, and support comes from the community unless you buy it from a third party.
7. Zoho Analytics
What it is: Zoho's BI and analytics product, which Zoho describes as an AI-powered BI platform with 500+ live data sources and 50+ chart types (Zoho).
Pricing (Zoho's pricing page): the Free plan covers 2 users, 10,000 rows and 5 workspaces with unlimited reports and dashboards. Paid plans scale by users and rows: Basic (2 users, 0.5 million rows), Standard (5 users, 1 million), Premium (15 users, 5 million) and Enterprise (50 users, 50 million). Standard and Premium add AI-narrated insights through Zoho's Zia assistant. Zoho offers a 15-day free trial, month-to-month billing and a 20% discount for annual billing, and notes that pricing varies by region (Zoho pricing).
Strengths: a free plan, month-to-month billing and a 20% annual discount.
Watch out for: plans are limited by row counts, so large datasets push you into higher tiers.
Free and Open Source Business Intelligence Tools
If budget is the first filter, these are the options from the list above:
- Power BI Desktop: free to build reports, though sharing requires a paid license (Microsoft pricing).
- Looker Studio: reported to be free for building and viewing reports.
- Metabase Open Source: free, with unlimited users when self-hosted (Metabase).
- Apache Superset: free and fully open source (Apache Superset).
- Zoho Analytics Free: 2 users and 10,000 rows (Zoho).
"Free" rarely means zero cost. Open-source tools shift cost to hosting and staff time, and free tiers have limits on users, rows or sharing that you may outgrow.
AI Business Intelligence Tools: What the Documentation Shows
Many BI products now advertise AI features, and the documentation shows what is actually offered:
- Power BI lists Copilot, described as an AI-powered assistant for insights and report creation, and natural-language Q&A (Microsoft Learn).
- Metabase's open-source edition includes AI question-asking and SQL generation, with optional paid AI tokens (Metabase).
- Qlik lists AI-powered analytics and "Answers Agents" on its plans (Qlik).
- Zoho Analytics offers narrated insights through its Zia assistant on Standard and Premium (Zoho).
AI features can speed up exploration, but they can also produce wrong or poorly explained answers. Check generated queries and numbers against a trusted source before acting on them. Our article on AI agents for business intelligence covers the opportunities and risks in more depth.
How to Choose a Business Intelligence Tool
Use these questions to narrow the list when choosing a business intelligence tool or platform.
- Where does your data live? Check that the tool connects to your databases, warehouse and key apps.
- Who builds and who views? Per-user and role-based pricing favor tools where only a few people build.
- How much data will you analyze? Capacity- and row-based plans (Qlik, Zoho) depend on volume.
- Do you have technical staff? Open-source tools such as Superset and self-hosted Metabase need them.
- What ecosystem are you in? Power BI is built around Microsoft, Looker around Google Cloud and Zoho Analytics around Zoho's apps, so existing tools can influence the choice.
- What do you need for governance? Check row-level security, SSO and audit features, which are often on higher tiers.
- What will it cost at scale? Estimate cost at your expected number of builders, viewers and data volume, not just the entry price.
- Can you try it first? Use free tiers and trials with your own data before committing.
Business Intelligence Tool vs Business Intelligence Platform
The two terms overlap, and vendors use them loosely. A reasonable distinction:
- A business intelligence tool does one job well, such as building charts and dashboards.
- A business intelligence platform bundles several jobs: connecting to data, preparing and modeling it, visualizing it, sharing it and governing access.
Power BI, for example, is described by Microsoft as a platform with a desktop authoring app, a cloud service and a mobile app, tied into the wider Microsoft Fabric ecosystem (Microsoft Learn). Lighter products may cover only part of that, which can be an advantage when you do not need the rest.
Questions to Ask Every Vendor
Use the same list with each vendor so the answers are comparable:
- What counts as a billable user, and do people who only view dashboards need a license?
- What are the limits on data volume, rows, refreshes or models in each plan?
- Which data sources connect out of the box, and which need paid connectors?
- What security features come with each tier, such as row-level security and single sign-on?
- Where does the data live, and can we meet our privacy and residency requirements?
- How do AI features work, what data do they see, and can we turn them off?
- What does it cost to export our work if we leave?
- What does support include, and is there a free trial we can use with our own data?
Tips for a Smooth First Rollout
- Start with one dashboard built around one decision, and put it in front of the people who will use it.
- Agree on metric definitions before you build, so teams do not argue over whose number is right.
- Limit who can edit. A few builders and many viewers is easier to govern than everyone building their own version.
- Plan refresh schedules. Check how often data updates and whether your plan supports the frequency you need.
- Review usage after a month. Remove dashboards nobody opens and improve the ones people use.
Understanding BI Pricing Models
The same price can mean very different things depending on the model.
- Per user: you pay for each person. Cheap for small teams, costly with many viewers. Power BI Pro is an example.
- Per role: different prices for creators, explorers and viewers, as reported for Tableau.
- Capacity-based: you pay for data capacity, and users may be unlimited. Qlik Cloud Analytics works this way.
- Per plan with included users: a base fee covers a set number of users, with extra users billed separately, as with Metabase.
- Quote-based: you negotiate with sales, as with the Looker platform.
- Open source: no license fee, but you pay for hosting and maintenance.
Ask what counts as a user, whether viewers need licenses, and what happens when you exceed limits.
Common Mistakes When Choosing BI Tools
- Picking by feature lists instead of fit. The best tool is the one your team will actually use.
- Ignoring viewers in the cost. Per-user models can get expensive when many people only need to look at dashboards.
- Underestimating data volume. Capacity or row limits can force an upgrade.
- Forgetting the cost of open source. Hosting, security and maintenance take time.
- Skipping a trial with real data. Demo data hides connection and performance problems.
- Buying governance features too late. Retrofitting security and shared definitions is harder than planning them.
- Trusting AI output blindly. Verify generated queries and numbers.
Frequently Asked Questions
What are business intelligence tools? Software that connects to data, lets users model and explore it, and presents the results as reports and dashboards so people can make decisions. IBM lists tools such as Tableau and Cognos Analytics as examples (IBM).
What is the best business intelligence tool? There isn't one. The seven tools here differ mainly in ecosystem and pricing: Power BI is per user, Tableau is reported to be per role, Looker belongs to Google Cloud, Qlik is capacity-based, and Metabase, Superset and Zoho Analytics have free options. Fit depends on your data, users and budget.
What are the best free business intelligence tools? Power BI Desktop is free for building reports, though sharing needs a paid license. Looker Studio is reported to be free, Metabase and Apache Superset have open-source editions, and Zoho Analytics has a free plan for 2 users and 10,000 rows.
What are the best open-source business intelligence tools? Apache Superset and the open-source edition of Metabase are two examples. Both can be self-hosted at no license cost, but you manage the infrastructure.
How much does Power BI cost? Power BI Desktop is free. Power BI Pro is listed at $14 per user per month paid yearly and Premium Per User at $24 per user per month paid yearly (Microsoft pricing).
How much does Tableau cost? Tableau's own page could not be read for this article. Third-party trackers report Cloud Standard at about $75 (Creator), $42 (Explorer) and $15 (Viewer) per user per month billed annually, so confirm with Tableau.
How much does Qlik cost? Qlik Cloud Analytics lists Starter at $300 a month, Standard at $825, Premium at $2,750 and Enterprise by quote (Qlik pricing).
What is the difference between Looker and Looker Studio? Looker Studio is Google's free report-building tool, while Looker is the enterprise BI platform sold by quote. They are separate products.
Do I need a data warehouse to use a BI tool? Not always. Many tools connect directly to databases, files and apps. A warehouse becomes useful as data grows and consistency matters. Data warehouses, data lakes and lakehouses each suit different needs, so compare them before building one.
How do I start with a BI tool? Pick one business question, connect the relevant data, build one dashboard and test with real users before expanding. Use free tiers or trials first.
Conclusion
The best business intelligence tool is the one that fits your data, your team and your budget. Power BI, Tableau, Looker, Qlik, Metabase, Superset and Zoho Analytics each take a different approach to pricing and deployment, from per-user licenses to capacity-based plans to open source you run yourself.
Start from the questions that decide fit: where your data lives, who builds and who views, how much data you have, and what governance you need. Try two or three tools with real data, estimate the cost at the scale you expect, and verify any AI-generated output. For the fundamentals behind all of this, read our guide to what business intelligence is.
Sources
- Microsoft, Power BI pricing and What is Power BI?
- Qlik, Qlik Cloud Analytics pricing
- Metabase, Pricing
- Apache Superset, Home
- Zoho, Zoho Analytics pricing
- IBM, What is business intelligence?
- Tableau, Dashboard best practices
- Tableau and Looker prices: reported by third-party pricing trackers, because the vendors' pricing pages could not be read; confirm with each vendor